最后结果图像不一样呀
来源:3-5 神经网络对数据实现分类(下)

KiKi00
2019-03-30 21:46
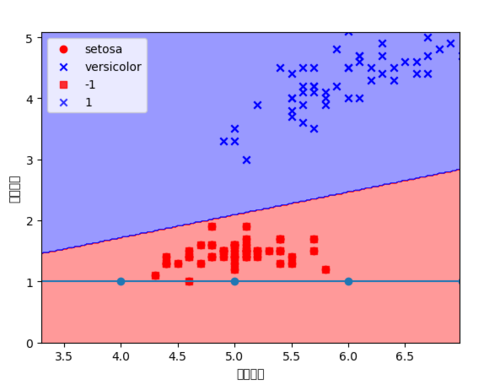
最后结果下面多了一条线?请问这种情况是怎么回事呀
写回答
关注
2回答
-

- Du1in9
- 2020-07-20 11:23:08
from matplotlib.colors import ListedColormap
from matplotlib.colors import ListedColormap def plot_decision_region(X, y, classifier, resolution=0.02): colors = ('red', 'blue', 'lightgreen', 'gray', 'cyan') cmap = ListedColormap(colors[:len(np.unique(y))]) x1_min, x1_max = X[:, 0].min() - 1, X[:, 0].max() x2_min, x2_max = X[:, 1].min() - 1, X[:, 1].max() xx1, xx2 = np.meshgrid(np.arange(x1_min, x1_max, resolution), np.arange(x2_min, x2_max, resolution)) z = classifier.predict(np.array([xx1.ravel(),xx2.ravel()]).T) z = z.reshape(xx1.shape) plt.contourf(xx1, xx2, z, alpha=0.4, cmap=cmap) plt.xlim(xx1.min(), xx1.max()) plt.xlim(xx2.min(), xx2.max()) plt.scatter(X[:50,0],X[:50,1],color='red',marker='o',label='setosa') plt.scatter(X[50:100,0],X[50:100,1],color='blue',marker='x',label='versicolor') # 执行语句 plot_decision_regions(X,y,ppn,resolution=0.02) plt.rcParams['font.sans-serif'] = ['SimHei'] plt.xlabel('花茎长度') plt.ylabel('花瓣长度') plt.legend(loc='upper left') plt.show() -

- 慕田峪4102898
- 2019-08-20 10:12:55
# plt.plot(range(1,len(ppn.errors_)+1),ppn.errors_,marker='o')
# plt.xlabel('Epochs')
# plt.ylabel('错误分类次数')
#plt.show()
这些代码注释掉


机器学习-实现简单神经网络
人工智能时代,你准备好成为抓住机遇的那百分之二吗。
67192 学习 · 186 问题
相似问题