不好意思,跳票了一周,有一些事情不得不处理,在这里给大家说一声抱歉~
本篇是一周学会Spring Cloud的最后一篇,学到这里大家就已经入门了,更重要的是我们以后将其用在实际的开发生产当中,希望大家加油~~
今天我们深入学习断路器监控Hystrix Dashboard,之前我们有过简单的使用。在微服务架构中为例保证程序的可用性,防止程序出错导致网络阻塞,出现了断路器模型。断路器的状况反应了一个程序的可用性和健壮性,它是一个重要指标。Hystrix Dashboard是作为断路器状态的一个组件,提供了数据监控和友好的图形化界面。
一.准备工程
建议大家新建工程,因为这样其他的单独的服务只要进行了熔断机制的,都可以在仪表盘上面去查看,此外,如果Dashboard和被监控工程整合到了一起,即便配置 feign.hystrix.enabled=true 也是检测不到 Feign 通道的数据的,在仪表盘界面一直是 Loading。所以,如果使用Feign ,建议Dashboard成为独立的项目。
1.创建hystrix-dashboard,引入依赖
<!-- 客户端负载均衡 -->
<dependency>
    <groupId>org.springframework.cloud</groupId>
    <artifactId>spring-cloud-starter-ribbon</artifactId>
</dependency>

<!-- eureka客户端 -->
<dependency>
    <groupId>org.springframework.cloud</groupId>
    <artifactId>spring-cloud-starter-eureka</artifactId>
</dependency>

<!-- hystrix 断路器 -->
<dependency>
    <groupId>org.springframework.cloud</groupId>
    <artifactId>spring-cloud-starter-hystrix</artifactId>
</dependency>

<dependency>
    <groupId>org.springframework.boot</groupId>
    <artifactId>spring-boot-starter-actuator</artifactId>
</dependency>

<!-- hystrix 断路器 仪表盘 -->
<dependency>
    <groupId>org.springframework.cloud</groupId>
    <artifactId>spring-cloud-starter-hystrix-dashboard</artifactId>
</dependency>
2.yml配置文件
eureka:
  client:
    serviceUrl:
      defaultZone: http://localhost:8761/eureka/

spring:
  application:
    name: hystrix-Dashboard

server:
  port: 9000
3.创建一个ConsumerController控制器
@RestController
public class ConsumerController {

    @Autowired
    private RestTemplate restTemplate;

    @HystrixCommand(fallbackMethod = "defaultStores")
    @GetMapping(value = "/hello")
    public String hello() {
        return restTemplate.getForEntity("http://eureka-client/", String.class).getBody();
    }

    public String defaultStores() {
        return "Ribbon + hystrix Dashboard ,提供者服务已失效";
    }
}
4.启动类上添加注解
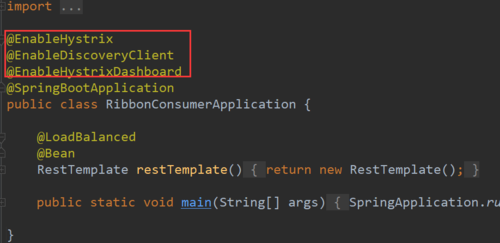
@EnableHystrix
@EnableDiscoveryClient
@EnableHystrixDashboard
@SpringBootApplication
public class RibbonConsumerApplication {

    @LoadBalanced
    @Bean
    RestTemplate restTemplate() {
        return new RestTemplate();
    }

   public static void main(String[] args) {
      SpringApplication.run(RibbonConsumerApplication.class, args);
   }
}
5.启动工程
拿出我们以前的小宝贝儿们,eureka-server,eureka-client,然后我们依次启动他们,eureka-client记得至少要启动两个不同端口,最后启动hystrix-dashboard。启动好之后去http://localhost:8761看一下注册有没有成功。
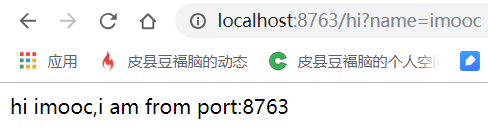
访问http://localhost:8766/hystrix.stream显示
接下来我们就该访问http://localhost:8766/hystrix.stream了,但是有的小伙伴会发生如下问题:
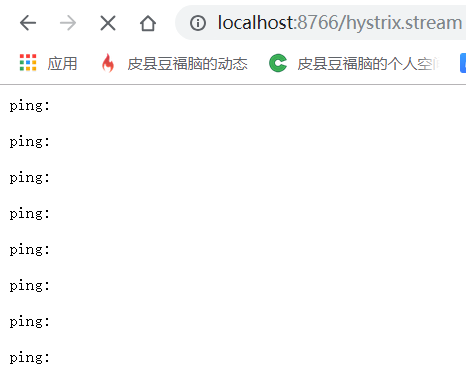
无限ping,这是为什么呢?是因为我们还没有通过8766仪表盘访问过两个client,所以我们需要先访问一下他们
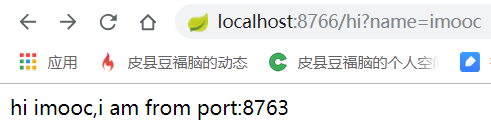
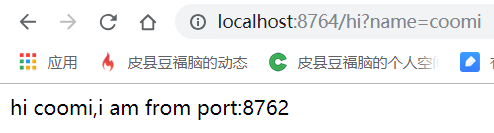
接下来我们再去访问http://localhost:8766/hystrix.stream
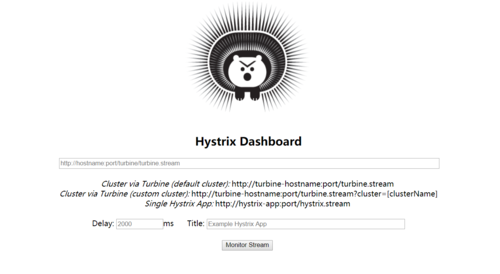
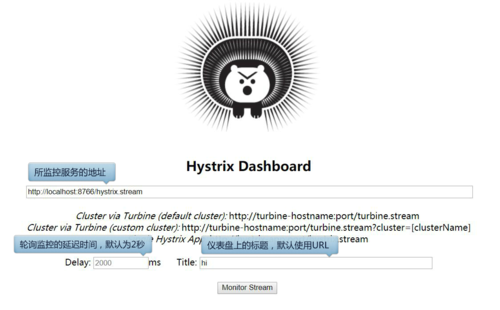
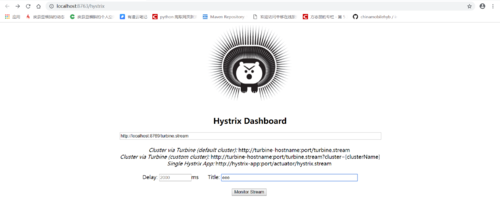
我们可以看到有大量数据了,这就说明我们刚刚已经成功调用了服务,并且监控已经记录,现在我们需要去http://localhost:8766/hystrix输入信息“http://localhost:8766/hystrix”,“2000”,“hi”。
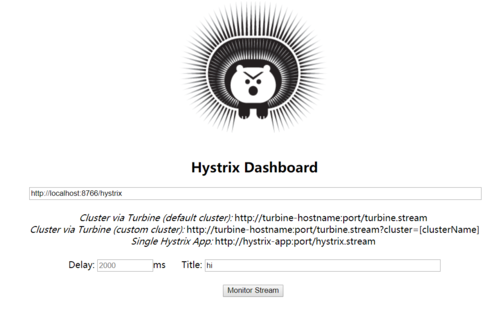
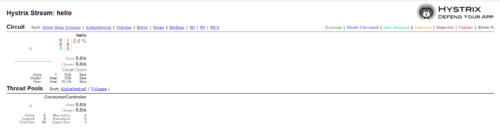
点击下面的Monitor Stream 然后我们就能看到还算美观的仪表盘界面:
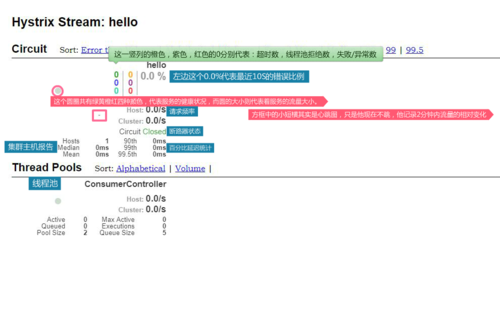
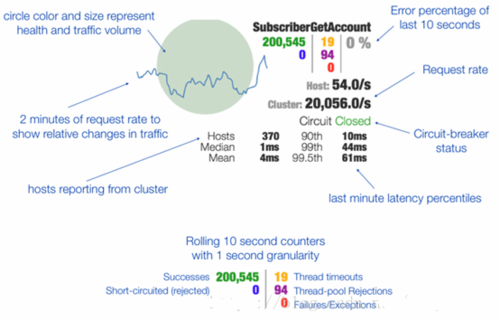
说了这么多,他们都分别是什么意思呢,我们来看(呕心力作之图和一张实际生产的图)。
以上便是Hystrix Dashboard的一个小详解。
二.聚合监控 Hystrix Turbine
上边我们讲述了如何利用Hystrix Dashboard去监控断路器的Hystrix command。当我们有很多个服务的时候,看单个的Hystrix Dashboard的数据并没有什么多大的价值,要聚合所以服务的Hystrix Dashboard的数据了。这就需要用到Spring Cloud的另一个组件了,即Hystrix Turbine。要想看这个系统的Hystrix Dashboard数据就需要用到Hystrix Turbine。Hystrix Turbine将每个服务Hystrix Dashboard数据进行了整合。
1.创建service-turbine,引入依赖
<!-- https://mvnrepository.com/artifact/org.springframework.cloud/spring-cloud-starter-turbine -->
<dependency>
    <groupId>org.springframework.cloud</groupId>
    <artifactId>spring-cloud-starter-turbine</artifactId>
    <version>1.1.3.RELEASE</version>
</dependency>
<dependency>
    <groupId>org.springframework.boot</groupId>
    <artifactId>spring-boot-starter-actuator</artifactId>
</dependency>
2.在入口类ServiceTurbineApplication加上注解@EnableTurbine,开启turbine,@EnableTurbine注解包含了@EnableDiscoveryClient注解,即开启了注册服务。
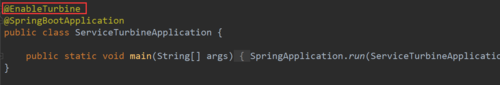
@EnableTurbine
@SpringBootApplication
public class ServiceTurbineApplication {

    public static void main(String[] args) {
        SpringApplication.run(ServiceTurbineApplication.class, args);
    }
}
3.配置文件application.yml
spring:
  application.name: service-turbine
server:
  port: 8769
security:
  basic:
  enabled: false
turbine:
  aggregator:
    clusterConfig: default   # 指定聚合哪些集群,多个使用","分割,默认为default。
    可使用http://.../turbine.stream?cluster={clusterConfig之一}访问
  appConfig: service-hi,service-lucy  ### 配置Eureka中的serviceId列表,
  表明监控哪些服务
  clusterNameExpression: new String("default")
  # 1. clusterNameExpression指定集群名称,默认表达式appName;
      此时:turbine.aggregator.clusterConfig需要配置想要监控的应用名称
  # 2. 当clusterNameExpression: default时,turbine.aggregator.clusterConfig可以不写,
      因为默认就是default
  # 3. 当clusterNameExpression: metadata['cluster']时,假设想要监控的应用配置了
          eureka.instance.metadata-map.cluster: ABC,则需要配置,同时
          turbine.aggregator.clusterConfig: ABC
eureka:
  client:
    serviceUrl:
      defaultZone: http://localhost:8761/eureka/
4.启动工程
依次开启eureka-server、service-hi、service-lucy、service-turbine工程。
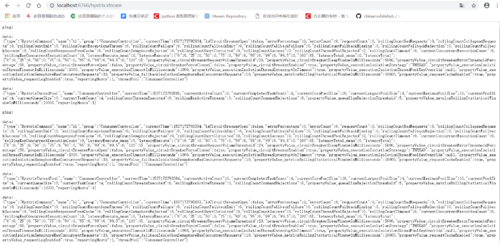
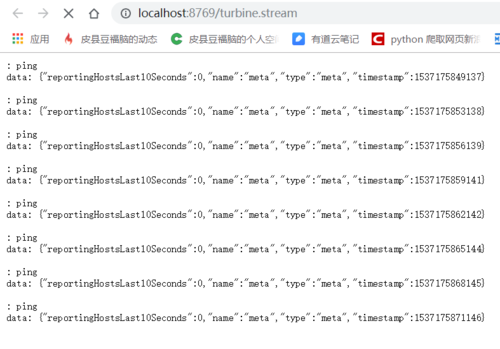
打开浏览器输入:http://localhost:8769/turbine.stream,界面如下
依次请求:
打开:http://localhost:8763/hystrix,输入监控流http://localhost:8769/turbine.stream
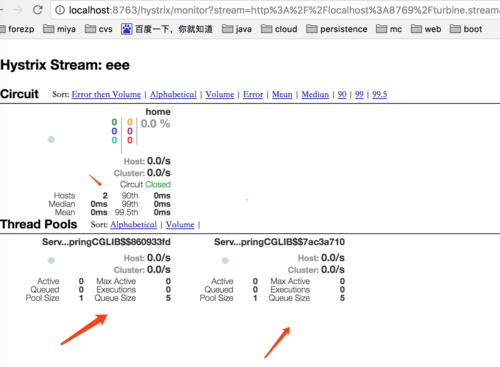
可以看到这个页面聚合了2个service的hystrix dashbord数据。
以上便是所有Spring Cloud中我所想分享给大家的内容,以这些知识作为铺垫,祝大家的技术更上一层楼~感谢大家阅读!
上一篇:一周学会Spring Cloud(Day5 消息总线和链路追踪)