
课程名称: Python办公自动化
课程章节:第6章 玩转PPT自动化
课程讲师: 离岛
课程内容:

本次实战课包含了前面介绍的添加文字、图表等内容。

import pptx
from pptx.util import Inches,Pt
from pptx.enum.shapes import MSO_SHAPE
from pptx.dml.color import  RGBColor
from pptx.chart.data import CategoryChartData
from pptx.enum.chart import XL_CHART_TYPE
from pptx.enum.chart import XL_LEGEND_POSITION

prs=pptx.Presentation()
#第一页
slide1=prs.slides.add_slide(prs.slide_layouts[0])
slide1.shapes.title.text='4S店汽车消费者洞察报告'
slide1.shapes.placeholders[1].text='2020年第一季度'
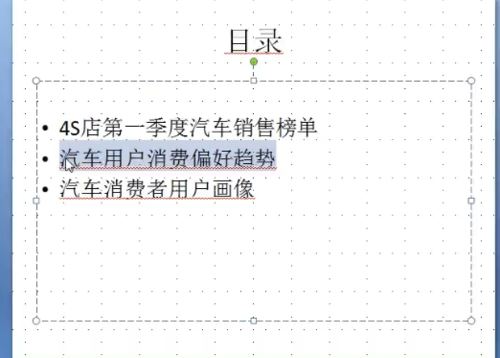
#第二页
slide2=prs.slides.add_slide(prs.slide_layouts[1])
slide2.shapes.title.text='目录'
content=slide2.shapes.placeholders[1].text_frame
content.add_paragraph().text='4S店第一季度汽车销售榜单'
content.add_paragraph().text='汽车用户消费偏好趋势'
content.add_paragraph().text='汽车消费者用户画像'
#第三页
slide3=prs.slides.add_slide(prs.slide_layouts[1])
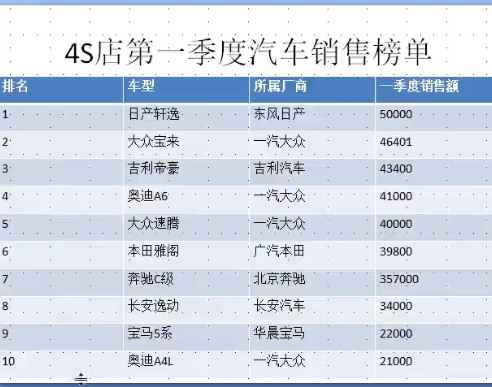
slide3.shapes.title.text='4S店第一季度汽车销售榜单'
table=slide3.shapes.add_table(11,4,Inches(0),Inches(1.4),Inches(10),Inches(6)).table
#写入内容
table.cell(0,0).text='排名'
table.cell(0,1).text='车型'
table.cell(0,2).text='所属厂商'
table.cell(0,3).text='一季度销售额'
data=[{'type':'日产轩逸','base':'东风日产','total':50000},
{'type':'大众宝米','base':'一汽大众','total':46401},
{'type':'吉利帝豪','base':'吉利汽车','total':43400},
{'type':'奥迪A6','base':'一汽大众','total':41000},
{'type':'大众速腾','base':'一汽大众','total':40000},
{'type':'本田雅阁','base':'广汽本田','total':39800},
{'type':'奔驰C级','base':'北京奔驰','total':357000},
{'type':'长安逸动','base':'长安汽车','total':34000},
{'type':'宝马5系','base':'华晨宝马','total':22000},
{'type':'奥迪A4L','base':'一汽大众','total':21000}]
for i in range(11):
if i>0:
table.cell(i,0).text=str(i)
table.cell(i, 1).text =data[i-1]['type']
table.cell(i, 2).text =data[i-1]['base']
table.cell(i, 3).text = str(data[i-1]['total'])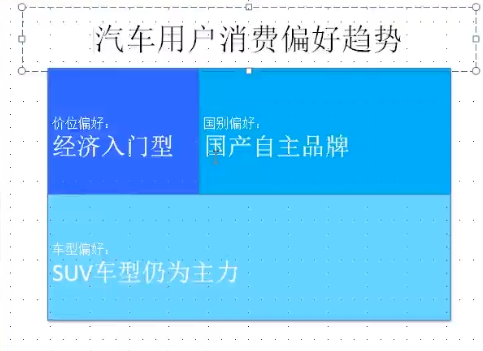
#第四页
slide4=prs.slides.add_slide(prs.slide_layouts[1])
slide4.shapes.title.text='汽车用户消费偏好趋势'
shape1=slide4.shapes.add_shape(MSO_SHAPE.RECTANGLE,Inches(1),Inches(1.5),Inches(3),Inches(2.5))
fill=shape1.fill
fill.solid()
fill.fore_color.rgb=RGBColor(51,102,255)
shape1.text_frame.add_paragraph().text='价位偏好:'
p1=shape1.text_frame.add_paragraph()
p1.text='经济入门型'
p1.font.size=Pt(35)
shape2=slide4.shapes.add_shape(MSO_SHAPE.RECTANGLE,Inches(4),Inches(1.5),Inches(4),Inches(2.5))
shape2.text_frame.add_paragraph().text='国别偏好:'
p2=shape2.text_frame.add_paragraph()
p2.text='国产自主品牌'
p2.font.size=Pt(35)
shape3=slide4.shapes.add_shape(MSO_SHAPE.RECTANGLE,Inches(1),Inches(4),Inches(8),Inches(2.5))
fill=shape3.fill
fill.solid()
fill.fore_color.rgb=RGBColor(112,219,255)
shape3.text_frame.add_paragraph().text='车型偏好:'
p3=shape3.text_frame.add_paragraph()
p3.text='SUV车型仍为主力'
p3.font.size=Pt(35)
#第五页
slide5=prs.slides.add_slide(prs.slide_layouts[1])
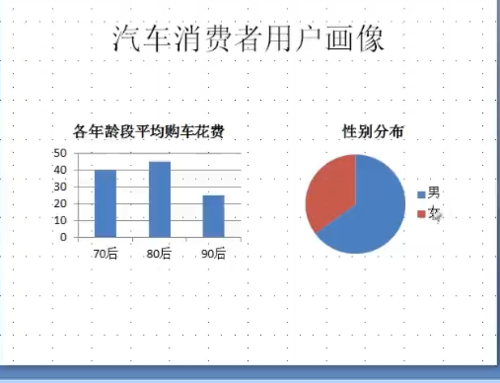
slide5.shapes.title.text='汽车消费者用户画像'
chart_data=CategoryChartData()
chart_data.categories=['70后','80后','90后']
chart_data.add_series('各年龄段平均购车花费',(40,45,25))
slide5.shapes.add_chart(
XL_CHART_TYPE.COLUMN_CLUSTERED,Inches(1),Inches(2.5),Inches(4),Inches(3),chart_data
)
chart_data1=CategoryChartData()
chart_data1.categories=['男','女']
chart_data1.add_series('性别分布',(65,35))
chart=slide5.shapes.add_chart(
XL_CHART_TYPE.PIE,Inches(6),Inches(2.5),Inches(3),Inches(3),chart_data
).chart
chart.has_legend=True
chart.legend.position=XL_LEGEND_POSITION.RIGHT
#第六页
slide6=prs.slides.add_slide(prs.slide_layouts[0])
slide6.shapes.title.text='谢谢'
prs.save('test1.pptx')课程收获:
作者:ninjaes
链接:https://www.imooc.com/article/329926
来源:慕课网