课程名称: Python办公自动化
课程章节:第6章 玩转PPT自动化
课程讲师: 离岛
课程内容:

本章节主要是添加表格到PPT
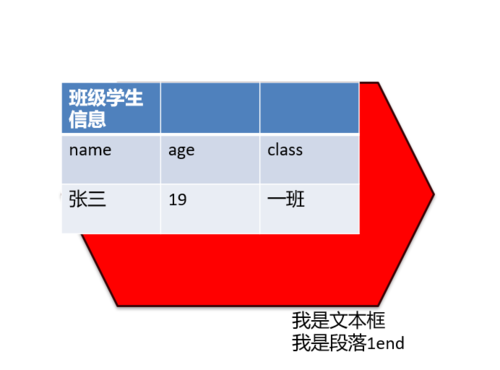
#添加表格
table=slide.shapes.add_table(3,3,Inches(2),Inches(2),Inches(4),Inches(2)).table
#填充内容
table.cell(1,0).text='name'
table.cell(1,1).text='age'
table.cell(1,2).text='class'
table.cell(2,0).text='张三'
table.cell(2,1).text='19'
table.cell(2,2).text='一班'
#合并单元格
cell=table.cell(0,0)
cell1=table.cell(0,2)
cell.merge(cell1)
table.cell(0,0).text='班级学生信息' #第一行
print(cell.is_merge_origin)#单元格是否合并
# cell.split()#取消合并
# print(cell.is_merge_origin)

#写入图表
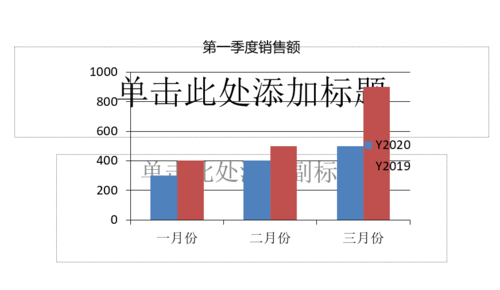
chart_data=CategoryChartData()
chart_data.categories=['一月份','二月份','三月份']#X轴
chart_data.add_series('Y2020',(300,400,500))
chart_data.add_series('Y2019',(400,500,900))

# 下面的是折线图, 如果要使用柱状图显示那么可以设置为COLUMN
chart=slide.shapes.add_chart(XL_CHART_TYPE.LINE,Inches(2),Inches(2),Inches(6),Inches(4),chart_data).chart
chart.has_title=True
chart.chart_title.text_frame.text='第一季度销售额' #标题
chart.has_legend=True
chart.legend.position=XL_LEGEND_POSITION.RIGHT
class pptx.chart.data.CategoryChartData(number_format=u'General')
累积指定图表类别和系列值的数据,并充当将要写入Excel工作表的图表数据表的代理。
课程收获:
本章节的内容补充了插入图表和表格的内容,对后续的PPT内容补充更完善,不仅仅是添加文字内容有图片的说明和显示更能突出实用的效果,后面继续努力完成该课程。

 随时随地看视频


