使用 for 循环 matplotlib 绘制图例
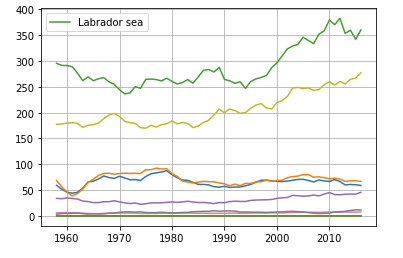
我正在尝试使用 for 循环绘制多条线,但我想为每条线创建一个单独的图例。每条线代表一个位置,如“拉布拉多海”等,但是当我尝试绘制每条线的图例时,只有第一个“拉布拉多海”可见如何为每条线制作 matplotlib 图作为图例,其中有可定制标签?
这是我到目前为止的代码:
fig,ax=plt.subplots()
lines = []
for i in [26,27,28,39,30,32,84,86,87,88,96,98,99]:
lines = ax.plot(years, mov_ave(fwf_tot.where(ds.ocean_basins == i).resample(TIME='1AS').sum().sum(dim=('X','Y')),5,'edges'))
#plt.title('Total FWF anomalies per ocean basin (moving average)')
ax.legend(lines[:13], ['Labrador sea','Hudson strait','Davis strait','Baffin bay', 'Lincoln sea', 'Irish sea and St. George', 'Arctic ocean', 'Barentsz sea', 'Greenland sea',
'North sea', 'Kategat', 'Skagerrak', 'Norwegian sea'],loc='upper left');
plt.grid()
plt.show()

 慕桂英546537
浏览 300回答 1
1回答
-

长风秋雁
你lines在每个情节之后重新定义。也许你想要:lines = []for i in [26,27,28,39,30,32,84,86,87,88,96,98,99]: line = ax.plot(years, mov_ave(fwf_tot.where(ds.ocean_basins == i).resample(TIME='1AS').sum().sum(dim=('X','Y')),5,'edges')) # add the line to line list lines.append(line)ax.legend(lines, ....)但是,我认为将标签传递给更干净ax.plot:labels = ['Labrador sea','Hudson strait','Davis strait','Baffin bay', 'Lincoln sea', 'Irish sea and St. George', 'Arctic ocean', 'Barentsz sea', 'Greenland sea', 'North sea', 'Kategat', 'Skagerrak', 'Norwegian sea']values = [26,27,28,39,30,32,84,86,87,88,96,98,99]for i,l in zip(values, labels): lines = ax.plot(years, mov_ave(fwf_tot.where(ds.ocean_basins == i) .resample(TIME='1AS').sum() .sum(dim=('X','Y')), 5,'edges'), label=l)plt.title('Total FWF anomalies per ocean basin (moving average)')ax.legend()plt.grid()plt.show()
 随时随地看视频慕课网APP
相关分类

 Python