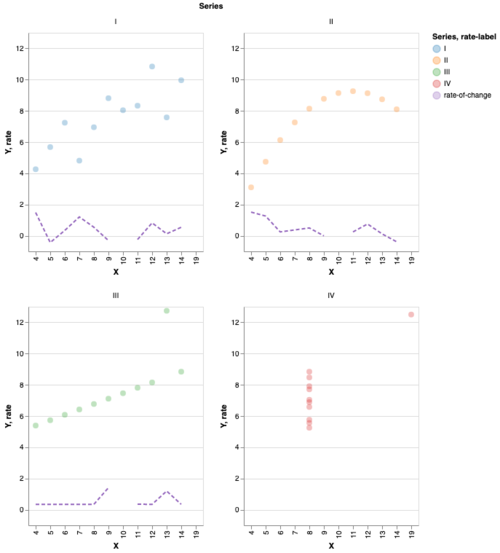
如何将系列特定线 y=x 添加到 Altair 中的多面(或类似)双轴图表?
y=x关于如何在使用 Altair时对双轴图表进行分面,然后向每个图表添加一条线,有什么建议吗?挑战在于,该线y=x需要与每个多面图表中显示的数据特定的系列比例相匹配。
链接:
下面是重现该问题的代码。
import altair as alt
from vega_datasets import data
source = data.anscombe().copy()
source['line-label'] = 'x=y'
source = pd.concat([source,source.groupby('Series').agg(x_diff=('X','diff'), y_diff=('Y','diff'))],axis=1)
source['rate'] = source.y_diff/source.x_diff
source['rate-label'] = 'rate-of-change'
base = alt.Chart().encode(
x='X:O',
)
scatter = base.mark_circle(size=60, opacity=0.30).encode(
y='Y:Q',
color=alt.Color('Series:O', scale=alt.Scale(scheme='category10')),
tooltip=['Series','X','Y']
)
line_x_equals_y = alt.Chart().mark_line(color= 'black', strokeDash=[3,8]).encode(
x=alt.X('max(X)',axis=None),
y=alt.Y('max(X)',axis=None), # note: it's intentional to set max(X) here so that X and Y are equal.
color = alt.Color('line-label') # note: the intent here is for the line label to show up in the legend
)
rate = base.mark_line(strokeDash=[5,3]).encode(
y=alt.Y('rate:Q'),
color = alt.Color('rate-label',),
tooltip=['rate','X','Y']
)
scatter_rate = alt.layer(scatter, rate, data=source)
尝试过的解决方案
问题:图表不是双轴(并且这不包括line_x_equals_y)
scatter_rate.facet('Series',columns=2).resolve_axis(
        x='independent',
        y='independent',
        )
问题:Javascript 错误
alt.layer(scatter_rate, line_x_equals_y, data=source).facet('Series',columns=2).resolve_axis(
x='independent',
y='independent',
)
问题:Javascript 错误
chart_generator = (alt.layer(line_x_equals_y, scatter_rate, data = source, title=f"Series {val}").transform_filter(alt.datum.Series == val).resolve_scale(y='independent',x='independent') \
for val in source.Series.unique())
alt.concat(*(
chart_generator
), columns=2)
目标
scatter_rate是一个多面(按系列)双轴图表,带有适合值范围的单独刻度。y=x每个多面图表都包含一条从 (0,0) 到y=max(X)各个图表的值的线。
 拉莫斯之舞
拉莫斯之舞3回答
-

红颜莎娜
您可以通过正常创建图层并调用facet()图层图表上的方法来完成此操作。唯一的要求是所有层共享相同的源数据;无需手动构建facet,并且在当前版本的Altair中无需为facet进行后期数据绑定:import altair as altfrom vega_datasets import dataimport pandas as pdsource = data.anscombe().copy()source['line-label'] = 'x=y'source = pd.concat([source,source.groupby('Series').agg(x_diff=('X','diff'), y_diff=('Y','diff'))],axis=1)source['rate'] = source.y_diff/source.x_diffsource['rate-label'] = 'line y=x'source_linear = source.groupby(by=['Series']).agg(x_linear=('X','max'), y_linear=('X', 'max')).reset_index().sort_values(by=['Series'])source_origin = source_linear.copy()source_origin['y_linear'] = 0source_origin['x_linear'] = 0source_linear = pd.concat([source_origin,source_linear]).sort_values(by=['Series'])source = source.merge(source_linear,on='Series').drop_duplicates()scatter = alt.Chart(source).mark_circle(size=60, opacity=0.60).encode( x='X:Q', y='Y:Q', color='Series:N', tooltip=['X','Y','rate'])rate = alt.Chart(source).mark_line(strokeDash=[5,3]).encode( x='X:Q', y='rate:Q', color = 'rate-label:N')line_plot = alt.Chart(source).mark_line(color= 'black', strokeDash=[3,8]).encode( x=alt.X('x_linear', title = ''), y=alt.Y('y_linear', title = ''), shape = alt.Shape('rate-label', title = 'Break Even'), color = alt.value('black'))alt.layer(scatter, rate, line_plot).facet( 'Series:N').properties( columns=2).resolve_scale( x='independent', y='independent') -

SMILET
y=x该解决方案为每个图表上的数据按比例构建所需的线;但是,点在合并步骤中重复,我不确定如何添加双轴速率。获取数据source = data.anscombe().copy()source['line-label'] = 'x=y'source = pd.concat([source,source.groupby('Series').agg(x_diff=('X','diff'), y_diff=('Y','diff'))],axis=1)source['rate'] = source.y_diff/source.x_diffsource['rate-label'] = 'line y=x'创建Y=X线数据source_linear = source.groupby(by=['Series']).agg(x_linear=('X','max'), y_linear=('X', 'max')).reset_index().sort_values(by=['Series'])source_origin = source_linear.copy()source_origin['y_linear'] = 0source_origin['x_linear'] = 0source_linear = pd.concat([source_origin,source_linear]).sort_values(by=['Series'])合并线性数据source = source.merge(source_linear,on='Series').drop_duplicates()构建图表scatter = alt.Chart().mark_circle(size=60, opacity=0.60).encode( x=alt.X('X', title='X'), y=alt.Y('Y', title='Y'), #color='year:N', tooltip=['X','Y','rate'])line_plot = alt.Chart().mark_line(color= 'black', strokeDash=[3,8]).encode( x=alt.X('x_linear', title = ''), y=alt.Y('y_linear', title = ''), shape = alt.Shape('rate-label', title = 'Break Even'), color = alt.value('black'))手动分面图chart_generator = (alt.layer(scatter, line_plot, data = source, title=f"{val}: Duplicated Points w/ Line at Y=X").transform_filter(alt.datum.Series == val) \ for val in source.Series.unique())组合图表chart = alt.concat(*( chart_generator), columns=3)chart.display() -

交互式爱情
该解决方案包括速率,但不是Y一个轴和rate另一个轴上的双轴。import altair as altfrom vega_datasets import dataimport pandas as pdsource = data.anscombe().copy()source['line-label'] = 'x=y'source = pd.concat([source,source.groupby('Series').agg(x_diff=('X','diff'), y_diff=('Y','diff'))],axis=1)source['rate'] = source.y_diff/source.x_diffsource['rate-label'] = 'rate of change'source['line-label'] = 'line y=x'source_linear = source.groupby(by=['Series']).agg(x_linear=('X','max'), y_linear=('X', 'max')).reset_index().sort_values(by=['Series'])source_origin = source_linear.copy()source_origin['y_linear'] = 0source_origin['x_linear'] = 0source_linear = pd.concat([source_origin,source_linear]).sort_values(by=['Series'])source = source.merge(source_linear,on='Series').drop_duplicates()scatter = alt.Chart(source).mark_circle(size=60, opacity=0.60).encode( x=alt.X('X', title='X'), y=alt.Y('Y', title='Y'), color='Series:N', tooltip=['X','Y','rate'])line_plot = alt.Chart(source).mark_line(color= 'black', strokeDash=[3,8]).encode( x=alt.X('x_linear', title = ''), y=alt.Y('y_linear', title = ''), shape = alt.Shape('line-label', title = 'Break Even'), color = alt.value('black'))rate = alt.Chart(source).mark_line(strokeDash=[5,3]).encode( x=alt.X('X', axis=None, title = 'X'), y=alt.Y('rate:Q'), color = alt.Color('rate-label',), tooltip=['rate','X','Y'])alt.layer(scatter, line_plot, rate).facet( 'Series:N').properties( columns=2).resolve_scale( x='independent', y='independent').display()
 随时随地看视频慕课网APP
相关分类


 Python