使用 Python 的 matplotlib 3D API 的轮廓问题
我正在尝试做一些类似于文档中的 3D 示例的事情,但使用点云而不是光滑表面。该示例将 2D 轮廓投影到三个坐标平面中的每一个平面上。这表明我能够在xy平面上做到这一点。
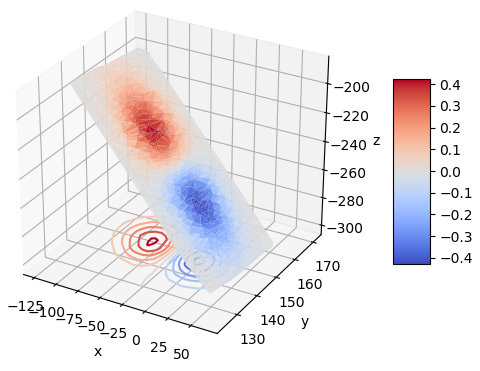
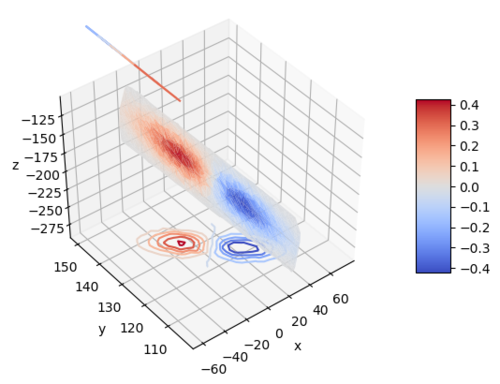
当我尝试在其他两个平面上做同样的事情时,我得到一个奇怪的轮廓塌陷成一条细条,
或者是我在 matplotlib 内部无法企及的例外。
Traceback (most recent call last):
File ".../matplotlib/backends/backend_qt5.py", line 519, in _draw_idle
self.draw()
File ".../matplotlib/backends/backend_agg.py", line 433, in draw
self.figure.draw(self.renderer)
File ".../matplotlib/artist.py", line 55, in draw_wrapper
return draw(artist, renderer, *args, **kwargs)
File ".../matplotlib/figure.py", line 1475, in draw
renderer, self, artists, self.suppressComposite)
File ".../matplotlib/image.py", line 141, in _draw_list_compositing_images
a.draw(renderer)
File ".../mpl_toolkits/mplot3d/axes3d.py", line 281, in draw
reverse=True)):
File ".../mpl_toolkits/mplot3d/axes3d.py", line 280, in <lambda>
key=lambda col: col.do_3d_projection(renderer),
File ".../mpl_toolkits/mplot3d/art3d.py", line 226, in do_3d_projection
self._segments3d]
File ".../mpl_toolkits/mplot3d/art3d.py", line 225, in <listcomp>
proj3d.proj_trans_points(points, renderer.M) for points in
File ".../mpl_toolkits/mplot3d/proj3d.py", line 188, in proj_trans_points
xs, ys, zs = zip(*points)
ValueError: not enough values to unpack (expected 3, got 0)
下面是该问题的一个示例。此版本有效。取消注释函数中的一个或两个调用,以查看奇怪的轮廓,或者更有可能是异常。ax.contour()plot()
这是 matplotlib 2.2.2 和 3.1.1 的。感谢您提供的任何帮助,以获得所有三个平面上的轮廓,例如演示。
 子衿沉夜
子衿沉夜1回答
-

慕桂英4014372
一位matplotlib开发人员指出,重新采样是错误的。修复后,这是更正后的情节。对于边上看到数据的坐标平面,例如本例中的 yz 平面,等高线看起来可能有点不稳定。这是意料之中的,因为数据可以接近多值。xz平面轮廓看起来也很粗糙。我怀疑这两个问题都可以通过单独三角化和轮廓化每个平面来改善,而不是像这里所做的那样偏爱 xy 平面。下面是固定的测试脚本。唯一重要的更改是 和 。plot()resample()import mathimport sysimport matplotlib as mplimport matplotlib.pyplot as pltimport mpl_toolkits.mplot3dimport numpy as npimport scipy.spatial#np.random.seed(4)numPts = 1000 # number of points in cloudnumGrid = 120 # number of points in meshgrid used in resample for contoursscatter = False # adds scatter plot to show point clouddef main(): (pts, f) = mkData() # create the point cloud tris = mkTris(pts) # triangulate it plot(pts, tris, f) # plot itdef plot(pts, tris, f): fig = plt.figure() ax = fig.add_subplot(111, projection="3d") cmap = plt.get_cmap("coolwarm") collec = ax.plot_trisurf(tris, pts[:, 2], cmap=cmap) colors = np.mean(f[tris.triangles], axis=1) collec.set_array(colors) collec.autoscale() (xr, yr, zr, fr, xMin, xMax, yMin, yMax, zMin, zMax) = resample(ax, tris, pts, f) ax.set_xlim(xMin, xMax) # default always includes zero for some reason ax.set_ylim(yMin, yMax) ax.set_zlim(zMin, zMax) ax.contour(xr, yr, fr, 10, zdir="z", cmap=cmap, offset=zMin) ax.contour(fr, yr, zr, 10, zdir="x", cmap=cmap, offset=xMin) ax.contour(xr, fr, zr, 10, zdir="y", cmap=cmap, offset=yMax) if scatter: ax.scatter(pts[:, 0], pts[:, 1], pts[:, 2], alpha=0.1) ax.set_xlabel("x") ax.set_ylabel("y") ax.set_zlabel("z") fig.colorbar(collec, shrink=0.5, aspect=5) plt.show()def mkData(): """ Create a random point cloud near a random plane, and define a function on the plane for colors and contours. """ offset = 1 # generate points near a unit square, xy-plane pts = 2 * np.random.rand(numPts, 3) - 1 pts[:, 2] = offset * (2 * np.random.rand(numPts) - 1) x = 2 * np.ravel(pts[:, 0]) y = 2 * np.ravel(pts[:, 1]) f = x * np.exp(-x**2 - y**2) # just some function for colors, contours width = 100 # scale unit square to a larger rectangle height = 20 pts[:, 0] *= width pts[:, 1] *= height (e1, e2, e3) =[2 * np.pi * np.random.rand() for _ in range(3)] (c1, s1) = (math.cos(e1), math.sin(e1)) # rotate scaled rectangle (c2, s2) = (math.cos(e2), math.sin(e2)) (c3, s3) = (math.cos(e3), math.sin(e3)) Ta2b = np.array(( # do not have scipy.spatial.transform [ c1 *c2, s2, -s1 * c2], [s1 * s3 - c1 * s2 * c3, c2 * c3, c1 *s3 + s1 * s2 * c3], [s1 * c3 + c1 * s2 * s3, -c2 * s3, c1 *c3 - s1 * s2 * s3])) pts = (Ta2b @ pts.T).T dist = 500 # translate away from the origin Ra2bNb = dist * (2 * np.random.rand(3, 1) - 1) pts += Ra2bNb.T return (pts, f)def mkTris(pts): "Triangulate the point cloud." u = np.ravel(pts[:, 0]) v = np.ravel(pts[:, 1]) try: return mpl.tri.Triangulation(u, v) except (ValueError, RuntimeError) as ex: sys.exit(f"Unable to compute triangulation: {ex}.")def resample(ax, tris, pts, f): "Resample the triangulation onto a regular grid for contours." (xMin, xMax) = ax.get_xlim() (yMin, yMax) = ax.get_ylim() (zMin, zMax) = ax.get_zlim() x = np.linspace(xMin, xMax, numGrid) y = np.linspace(yMin, yMax, numGrid) (xm, ym)=np.meshgrid(x, y) fInterp = mpl.tri.CubicTriInterpolator(tris, f) fm = fInterp(xm, ym) zInterp = mpl.tri.CubicTriInterpolator(tris, pts[:,2]) zm = zInterp(xm, ym) return (xm, ym, zm, fm, xMin, xMax, yMin, yMax, zMin, zMax)if __name__ == "__main__": main()

相关分类
 Python