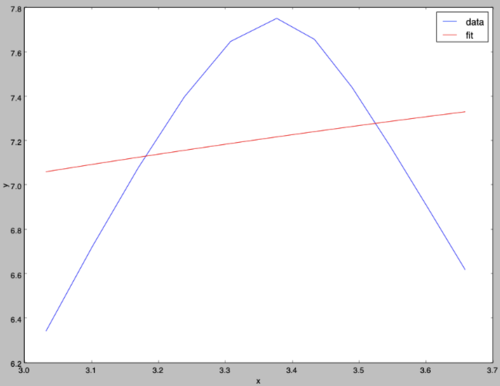
使用 curve.fit 过度拟合
谁能帮我解决 curve.fit 的拟合问题。我想将我的数据拟合到二阶方程。但我得到了像线性方程一样的结果。

这是我的代码:
import numpy as np
import matplotlib.pyplot as plt
from scipy.optimize import curve_fit
def func(x, a, b, c):
f = a*np.power(x, 2) + b*x + c
return f
xdata_prime=[3.0328562996216282, 3.101784841139168, 3.1707134502066894, 3.2396419917242292, 3.308570533241769, 3.3774990747593088, 3.3774990747593088, 3.4337789932367149, 3.4900589392912855, 3.5463388577686916, 3.6026187762460977, 3.6588987223006684]
ydata_prime=[6.344300000000002, 6.723900000000002, 7.080399999999999, 7.399800000000001, 7.649099999999999, 7.753100000000002, 7.753100000000002, 7.658600000000002, 7.442100000000002, 7.180100000000001, 6.902700000000001, 6.6211]
plt.plot(xdata_prime, ydata_prime, 'b-', label='data')
popt, pcov = curve_fit(func, xdata_prime, ydata_prime)
popt
plt.plot(xdata_prime, func(xdata_prime, *popt), 'r-',label='fit')
plt.xlabel('x')
plt.ylabel('y')
plt.legend()
plt.show()
 守候你守候我
1回答
-

青春有我
您的数组需要是 numpy 数组,因为您的函数正在执行向量化操作(即 a*np.power(x, 2))。所以这样你的代码就可以工作了:import numpy as npimport matplotlib.pyplot as pltfrom scipy.optimize import curve_fitdef func(x, a, b, c): f = a*np.power(x, 2) + b*x + c return fxdata_prime=np.array([3.0328562996216282, 3.101784841139168, 3.1707134502066894, 3.2396419917242292, 3.308570533241769, 3.3774990747593088, 3.3774990747593088, 3.4337789932367149, 3.4900589392912855, 3.5463388577686916, 3.6026187762460977, 3.6588987223006684])ydata_prime=np.array([6.344300000000002, 6.723900000000002, 7.080399999999999, 7.399800000000001, 7.649099999999999, 7.753100000000002, 7.753100000000002, 7.658600000000002, 7.442100000000002, 7.180100000000001, 6.902700000000001, 6.6211])plt.plot(xdata_prime, ydata_prime, 'b-', label='data')popt, pcov = curve_fit(func, xdata_prime, ydata_prime)plt.plot(xdata_prime, func(xdata_prime, *popt), 'r-',label='fit')plt.xlabel('x')plt.ylabel('y')plt.legend()plt.show()
 随时随地看视频慕课网APP
相关分类

 Python