Python:从数据趋势中查找异常值
我在实验中得到了数据:
import matplotlib.pyplot as plt
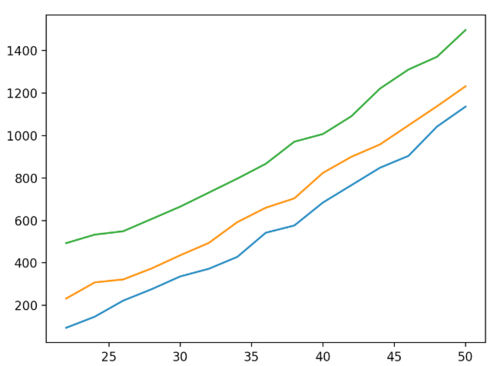
x = [22, 24, 26, 28, 30, 32, 34, 36, 38, 40, 42, 44, 46, 48, 50]
y_NaOH = [94.2, 146.2, 222.2, 276.2, 336.2, 372.2, 428.2, 542.2, 576.2, 684.2, 766.2, 848.2, 904.2, 1042.2, 1136.2]
y_NaHCO3 = [232.0, 308.0, 322.0, 374.0, 436.0, 494.0, 592.0, 660.0, 704.0, 824.0, 900.0, 958.0, 1048.0, 1138.0, 1232.0]
y_BaOH2 = [493.1, 533.1, 549.1, 607.1, 665.1, 731.1, 797.1, 867.1, 971.1, 1007.1, 1091.1, 1221.1, 1311.1, 1371.1, 1497.1, ]
plt.plot(x, y_NaOH)
plt.plot(x, y_NaHCO3)
plt.plot(x, y_BaOH2)
plt.show()
但是,我在标记异常值时遇到了困难,这是我尝试过的:
import matplotlib.pyplot as plt
import statistics
x = [22, 24, 26, 28, 30, 32, 34, 36, 38, 40, 42, 44, 46, 48, 50]
y_NaOH = [94.2, 146.2, 222.2, 276.2, 336.2, 372.2, 428.2, 542.2, 576.2, 684.2, 766.2, 848.2, 904.2, 1042.2, 1136.2]
y_NaHCO3 = [232.0, 308.0, 322.0, 374.0, 436.0, 494.0, 592.0, 660.0, 704.0, 824.0, 900.0, 958.0, 1048.0, 1138.0, 1232.0]
y_BaOH2 = [493.1, 533.1, 549.1, 607.1, 665.1, 731.1, 797.1, 867.1, 971.1, 1007.1, 1091.1, 1221.1, 1311.1, 1371.1, 1497.1, ]
# plt.plot(x, y_NaOH)
# plt.plot(x, y_NaHCO3)
# plt.plot(x, y_BaOH2)
# plt.show()
def detect_outlier(data_1):
threshold = 1
mean_1 = statistics.mean(data_1)
std_1 = statistics.stdev(data_1)
result_dataset = [y for y in data_1 if abs((y - mean_1)/std_1)<=threshold ]
return result_dataset
if __name__=="__main__":
dataset = y_NaHCO3
result_dataset = detect_outlier(dataset)
print(result_dataset)
# [374.0, 436.0, 494.0, 592.0, 660.0, 704.0, 824.0, 900.0, 958.0]
错误的是,这种方法总是过滤掉我的数据的边缘值,实际上我试图删除不适合曲线的点。
另外,我可以手动观察曲线的形状并标记异常值,但这确实花费了很多时间。我将非常感谢您的帮助。
 HUWWW
HUWWW1回答
-

炎炎设计
有很多用于数据科学的 GitHub 存储库,您所要做的就是完成git 安装用于使用outliers.py from outliers.variance import graph x = [22, 24, 26, 28, 30, 32, 34, 36, 38, 40, 42, 44, 46, 48, 50] y_NaOH = [94.2, 146.2, 222.2, 276.2, 336.2, 372.2, 428.2, 542.2, 576.2, 684.2, 766.2, 848.2, 904.2, 1042.2, 1136.2] y_NaHCO3 = [232.0, 308.0, 322.0, 374.0, 436.0, 494.0, 592.0, 660.0, 704.0, 824.0, 900.0, 958.0, 1048.0, 1138.0, 1232.0] y_BaOH2 = [493.1, 533.1, 549.1, 607.1, 665.1, 731.1, 797.1, 867.1, 971.1, 1007.1, 1091.1, 1221.1, 1311.1, 1371.1, 1497.1, ] graph( xs=x, ys=[y_NaOH, y_NaHCO3, y_BaOH2], title='title', legends=[f'legend {i + 1}' for i in range(len(x))], xlabel='xlabel', ylabel='ylabel', )

相关分类
 Python