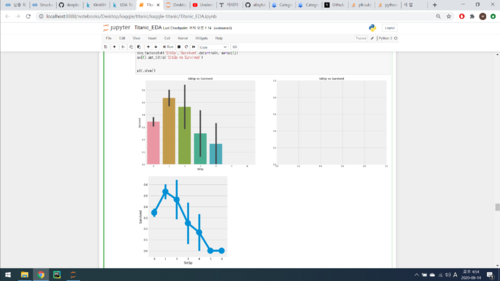
plt.subplot 制作空图
我想输入 2 个表以适合 1 行和 2 列,因此我设置了子图 (1, 2),但显示带有空图的 (2, 2) 形状(我使用 Jupyter 笔记本%matplotlib inline)
我该如何解决?
f,ax=plt.subplots(1,2,figsize=(20,8))
sns.barplot('SibSp','Survived',data=train, ax=ax[0])
ax[0].set_title('SibSp vs Survived')
sns.factorplot('SibSp','Survived',data=train, ax=ax[1])
ax[1].set_title('SibSp vs Survived')
plt.show()

 江户川乱折腾
浏览 185回答 1
1回答
-

米脂
该factorplot函数已catplot在 Seaborn 中重命名为。但我认为catplot不接受轴参数(但不确定)。最简单的方法是使用pointplot而不是factorplot.f,ax=plt.subplots(1,2,figsize=(20,8))sns.barplot('SibSp','Survived',data=train, ax=ax[0])ax[0].set_title('SibSp vs Survived')sns.pointplot('SibSp','Survived',data=train, ax=ax[1])ax[1].set_title('SibSp vs Survived')plt.show()
 随时随地看视频慕课网APP
相关分类

 Python