如何找到拟合多项式特征模型的回归曲线方程
import numpy as np
import pandas as pd
import matplotlib.pyplot as plt
from sklearn.linear_model import LinearRegression
from sklearn.preprocessing import PolynomialFeatures
data=pd.DataFrame(
{"input":
[0.001,0.015,0.066,0.151,0.266,0.402,0.45,0.499,0.598,0.646,0.738,0.782,0.86,0.894,0.924,0.95],
"output":[0.5263157894736842,0.5789473684210524,0.6315789473684206,0.6842105263157897,
0.6315789473684206, 0.7894736842105263, 0.8421052631578945, 0.7894736842105263, 0.736842105263158,
0.6842105263157897, 0.736842105263158, 0.736842105263158,0.6842105263157897, 0.6842105263157897,
0.6315789473684206,0.5789473684210524]})
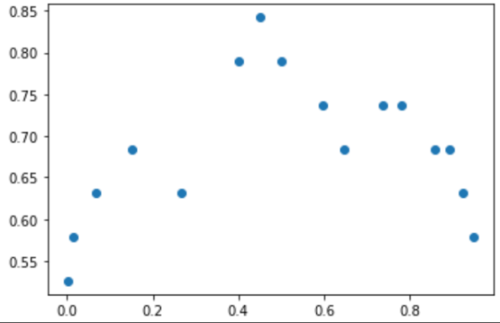
我有上述数据,其中包括输入和输出数据,我想制作一条正确拟合这些数据的曲线。首先绘制输入和输出值:

我已经编写了这段代码:
X=data.iloc[:,0].to_numpy()
X=X.reshape(-1,1)
y=data.iloc[:,1].to_numpy()
y=y.reshape(-1,1)
poly=PolynomialFeatures(degree=2)
poly.fit(X,y)
X_poly=poly.transform(X)
reg=LinearRegression().fit(X_poly,y)
plt.scatter(X,y,color="blue")
plt.plot(X,reg.predict(X_poly),color="orange",label="Polynomial Linear Regression")
plt.xlabel("Temperature")
plt.ylabel("Pressure")
plt.legend(loc="upper left")
情节是:

但是我没有找到上面的曲线方程(橙色曲线)我怎么找到?
 一只斗牛犬
一只斗牛犬2回答
-

胡说叔叔
您的绘图实际上对应于您运行的代码poly=PolynomialFeatures(degree=7)而不是degree=2。事实上,通过上述更改运行代码,我们得到:现在,您的多项式特征是:poly.get_feature_names()# ['1', 'x0', 'x0^2', 'x0^3', 'x0^4', 'x0^5', 'x0^6', 'x0^7']线性回归的相应系数是:reg.coef_# array([[ 0. , 5.43894411, -68.14277256, 364.28508827,# -941.70924401, 1254.89358662, -831.27091422, 216.43304954]])加上截距:reg.intercept_# array([0.51228593])鉴于上述情况,并设置coef = reg.coef_[0]由于这里我们的初始数据只有一个特征,因此您的回归方程为:y = reg.intercept_ + coef[0] + coef[1]*x + coef[2]*x**2 + coef[3]*x**3 + coef[4]*x**4 + coef[5]*x**5 + coef[6]*x**6 + coef[7]*x**7为了进行视觉验证,我们可以用以下x数据绘制上述函数[0, 1]x = np.linspace(0, 1, 15) 运行上面的表达式y并plt.plot(x, y)给出:使用一些随机生成的数据x,我们可以验证方程的结果y_eq确实等于y_reg数值精度范围内回归模型产生的结果:x = np.random.rand(1,10)y_eq = reg.intercept_ + coef[0] + coef[1]*x + coef[2]*x**2 + coef[3]*x**3 + coef[4]*x**4 + coef[5]*x**5 + coef[6]*x**6 + coef[7]*x**7y_reg = np.concatenate(reg.predict(poly.transform(x.reshape(-1,1)))) y_eq# array([[0.72452703, 0.64106819, 0.67394222, 0.71756648, 0.71102853,# 0.63582055, 0.54243177, 0.71104983, 0.71287962, 0.6311952 ]])y_reg# array([0.72452703, 0.64106819, 0.67394222, 0.71756648, 0.71102853,# 0.63582055, 0.54243177, 0.71104983, 0.71287962, 0.6311952 ])np.allclose(y_reg, y_eq)# True与问题无关,我想您已经知道尝试将如此高阶的多项式拟合到如此少的数据点并不是一个好主意,并且您可能应该保持 2 或 3 的低阶数...... -

catspeake
请注意您如何生成问题中所示的图。当我运行你的代码时,我得到了以下(度= 2)多项式,按预期拟合数据:现在您已经拟合了数据,您可以看到模型的系数:print(reg.coef_)print(reg.intercept_)# [[ 0. 0.85962436 -0.83796885]]# [0.5523586]请注意,用于拟合此模型的数据相当于以下内容:X_poly = np.concatenate([np.ones((16,1)), X, X**2], axis=1)因此,单个数据点是按如下方式创建的向量:temp = 0.5x = np.array([1, temp, temp**2]).reshape((1,3))您的多项式模型只是多项式特征的线性模型:y = 轴 + B或者y = reg.coef_.dot(x.T) + reg.intercept_print(y) # [[0.77267856]]确认:print(reg.predict(x)) # array([[0.77267856]])
 随时随地看视频慕课网APP
相关分类


 Python