在 ChartJS 和 PHP 中分组数据
您好有一个数据表,我正在尝试使用 ChartJS 绘制图表。数据数组如下所示
Array
(
[0] => Array
(
[Sort] => 2
[Weeks] => 1-2 Weeks
[Severity] => P1
[Count] => 7
)
[1] => Array
(
[Sort] => 2
[Weeks] => 1-2 Weeks
[Severity] => P2
[Count] => 3
)
[2] => Array
(
[Sort] => 2
[Weeks] => 1-2 Weeks
[Severity] => P3
[Count] => 4
)
[3] => Array
(
[Sort] => 2
[Weeks] => 1-2 Weeks
[Severity] => P4
[Count] => 3
)
[4] => Array
(
[Sort] => 3
[Weeks] => 2-3 weeks
[Severity] => P1
[Count] => 1
)
[5] => Array
(
[Sort] => 4
[Weeks] => >4 weeks
[Severity] => No Value
[Count] => 1
)
[6] => Array
(
[Sort] => 4
[Weeks] => >4 weeks
[Severity] => P1
[Count] => 1
)
[7] => Array
(
[Sort] => 4
[Weeks] => >4 weeks
[Severity] => P3
[Count] => 1
)
)
我转换了与 ChartJS 兼容的数组,如下所示
Array
(
[labels] => Array
(
[0] => >4 weeks
[1] => 2-3 weeks
[2] => 1-2 Weeks
)
[datasets] => Array
(
[0] => Array
(
[label] => No Value
[backgroundColor] => #F00
[borderColor] => #F00
[borderWidth] => 1
[maxBarThickness] => 50
[data] => Array
(
[0] => 1
)
)
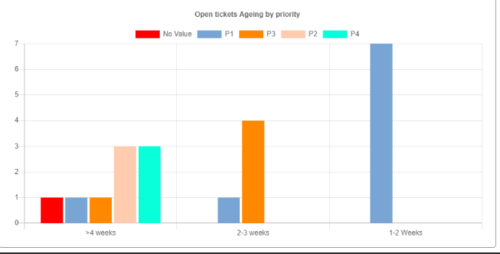
但是当数据绘制到图表时,数据会被打乱。数据是这样排列的

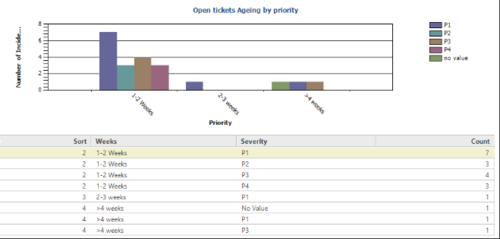
这是真实数据以及图表的外观

 潇潇雨雨
潇潇雨雨1回答
-

犯罪嫌疑人X
您的代码有几个问题。首先,你的数据集应该有标签数量的数据,这样你就不能在不填充的情况下忽略空白的地方。要解决此问题,您需要更改 $parsedAry['datasets'][$i]['data'] = array();为$parsedAry['datasets'][$i]['data'] = array(0, 0, 0, 0, 0);这将在您的数据集中添加 5 个空位。其次,您必须为此将数字放在正确的位置,您必须为最后一个循环添加一个计数器以识别正确的位置。最后你的代码应该是这样的。function chart(){ $ar = RNCPHP\AnalyticsReport::fetch('Open tickets Ageing by priority'); $arr = $ar->run(0, $filters); $chartInit = array(); $chartArr['data'] = array(); // push the report data into an array for ($ii = $arr->count(); $ii--;) { $row = $arr->next(); if ($row['Severity'] == null || $row['Severity'] == "") { $row['Severity'] = "No Value"; } $row['Sort'] = $row['Sort']; array_push($chartInit, $row); } echo "<pre>"; print_r($chartInit); array_multisort(array_map(function ($element) { return $element['Sort']; }, $chartInit), SORT_DESC, $chartInit); $chartDataArr = array(); $sevArr = array(); foreach ($chartInit as $k => $v) { if (!isset($chartDataArr[$v['Weeks']])) { $chartDataArr[$v['Weeks']] = array(); } array_push($chartDataArr[$v['Weeks']], $v); if (!in_array($v['Severity'], $sevArr)) { array_push($sevArr, $v['Severity']); } } $mapLabels = array(); $parsedAry = array(); $parsedAry['labels'] = array(); $parsedAry['datasets'] = array(); for ($i = 0; $i < count($sevArr); $i++) { $parsedAry['datasets'][$i] = array(); $parsedAry['datasets'][$i]['label'] = $sevArr[$i]; $parsedAry['datasets'][$i]['backgroundColor'] = $this->getColor($i); $parsedAry['datasets'][$i]['borderColor'] = $this->getColor($i); $parsedAry['datasets'][$i]['borderWidth'] = 1; $parsedAry['datasets'][$i]['maxBarThickness'] = 50; $parsedAry['datasets'][$i]['data'] = array(0, 0, 0, 0, 0); } $labelsNo = 0; foreach ($chartDataArr as $k => $v) { array_push($parsedAry['labels'], $k); foreach ($v as $k1 => $v1) { $keySev = ""; foreach ($parsedAry['datasets'] as $k2 => $v2) { if ($v2['label'] == $v1['Severity']) { $keySev = $k2; } } if ($v1['Count'] == null || $v1['Count'] == "") { $v1['Count'] = 0; } $parsedAry['datasets'][$keySev]['data'][$labelsNo] = $v1['Count']; } $labelsNo++; } echo "<pre>"; print_r($parsedAry); echo "</pre>"; $chartArr['data'] = $parsedAry; return $chartArr;}
 随时随地看视频慕课网APP

 PHP
PHP