如何在 ng-apexchart 中禁用工具提示
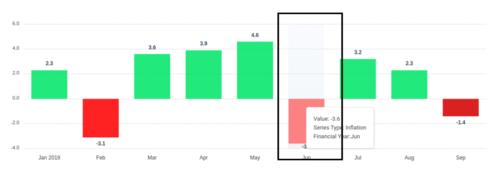
我正在将顶点图表集成到我的角度应用程序中,实现顶点折线图。我想隐藏尝试启用选项的工具提示:false。但没有工作。甚至无法将自定义工具提示设置为折线图。当悬停在系列上时,它显示一些垂直虚线,我需要隐藏工具提示或隐藏垂直虚线并创建自定义工具提示。
任何建议都会很有帮助。谢谢。
import { Component, ViewChild, OnInit } from '@angular/core';
import {
ChartComponent,
ApexAxisChartSeries,
ApexChart,
ApexXAxis,
ApexDataLabels,
ApexTitleSubtitle,
ApexStroke,
ApexGrid,
ApexLegend,
ApexTooltip,
ApexYAxis,
} from 'ng-apexcharts';
export interface ChartOptions {
series: ApexAxisChartSeries;
chart: ApexChart;
xaxis: ApexXAxis;
yaxis: ApexYAxis;
dataLabels: ApexDataLabels;
grid: ApexGrid;
stroke: ApexStroke;
title: ApexTitleSubtitle;
legend: ApexLegend;
tooltip: ApexTooltip;
}
@Component({
selector: 'app-line-chart',
templateUrl: './line-chart.component.html',
styleUrls: ['./line-chart.component.css'],
})
export class LineChartComponent implements OnInit {
@ViewChild('lineChart') lineChart: ChartComponent;
public chartOptions: Partial<ChartOptions>;
constructor() {}
ngOnInit(): void {
this.chartOptions = {
series: [
{
name: 'Desktops',
data: [10, 41, 35, 51, 49, 62, 69, 91, 148],
},
{
name: 'Laptops',
data: [22, 55, 66, 77, 88, 99, 90, 110, 170],
},
],
chart: {
height: 350,
type: 'line',
zoom: {
enabled: false,
},
toolbar: {
tools: {
download: false,
},
},
},
dataLabels: {
enabled: false,
},
stroke: {
curve: 'straight',
},
grid: {
row: {
colors: ['#f3f3f3', 'transparent'], // takes an array which will be repeated on columns
opacity: 0.5,
},
},
yaxis: {
tooltip: {
enabled: false,
},
},

 慕沐林林
慕沐林林1回答
-

繁星淼淼
您缺少组件中的工具提示属性<apx-chart ... [tooltip]="chartOptions.tooltip" #lineChart></apx-chart>
 随时随地看视频慕课网APP
相关分类

 JavaScript