Python Matplotlib Multicursor:在图例中显示光标下的值
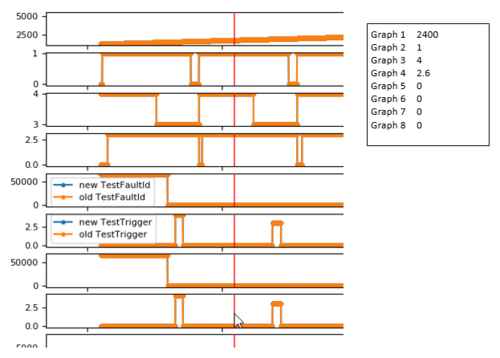
我正在使用 Multicursor 在每个图形上获取光标。我想在将鼠标悬停在图表上时在图例中显示被光标击中的数据点的值,就像这样

实际上我一直认为这是 matplotlib 和 Multicursor 的标准功能,但似乎不是。有人已经这样做了,还是我必须自己实施。
我已经在 cursor 下找到了这篇文章 matplotlib multiple values,但这可能只是我想要的实现的开始。
 慕码人2483693
浏览 495回答 1
1回答
-

米琪卡哇伊
我已经开发了一个解决方案。import matplotlib.pyplot as pltimport numpy as npfrom matplotlib.widgets import MultiCursorfrom bisect import bisect_leftfig = plt.figure(figsize=(15, 8))# create random graph with 60 datapoints, 0 till 59x = list(range(0,60))axes_list = [] def createRandomGraph(ax,x): y = np.random.randint(low=0, high=15, size=60) data.append(y) ax.plot(x,y, marker='.')def take_closest(myList, myNumber): """ Assumes myList is sorted. Returns closest value to myNumber. If two numbers are equally close, return the smallest number. """ pos = bisect_left(myList, myNumber) if pos == 0: return myList[0] if pos == len(myList): return myList[-1] before = myList[pos - 1] after = myList[pos] if after - myNumber < myNumber - before: return after, pos else: return before, pos-1def show_Legend(event): #get mouse coordinates mouseXdata = event.xdata # the value of the closest data point to the current mouse position shall be shown closestXValue, posClosestXvalue = take_closest(data[0], mouseXdata) i = 1 for ax in axes_list: datalegend = ax.text(1.05, 0.5, data[i][posClosestXvalue], fontsize=7, verticalalignment='top', bbox=props, transform=ax.transAxes) ax.draw_artist(datalegend) # this remove is required because otherwise after a resizing of the window there is # an artifact of the last label, which lies behind the new one datalegend.remove() i +=1 fig.canvas.update()# store the x value of the graph in the first element of the listdata = [x]# properties of the legend labelsprops = dict(boxstyle='round', edgecolor='black', facecolor='wheat', alpha=1.5)for i in range(5): if(i>0): # all plots share the same x axes, thus during zooming and panning # we will see always the same x section of each graph ax = plt.subplot(5, 1, i+1, sharex=ax) else: ax = plt.subplot(5, 1, i+1) axes_list.append(ax) createRandomGraph(ax,x) multi = MultiCursor(fig.canvas, axes_list, color='r', lw=1) # function show_Legend is called while hovering over the graphs fig.canvas.mpl_connect('motion_notify_event', show_Legend)plt.show()输出看起来像这样https://i.stack.imgur.com/ksxGW.gif
 随时随地看视频慕课网APP
相关分类

 Python