React ChartJS 2:点击图表获取数据
我在 StackOverflow 和 GitHub 上发现了许多其他问题,但没有一个对我有用......
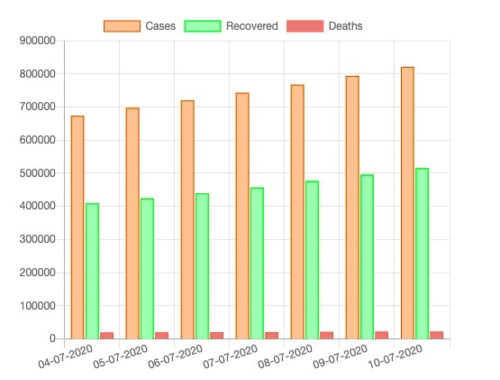
我有一个使用 ChartJS 构建的图表。当我单击任何条(橙色、绿色或红色)时,我想获得相应的值。有什么办法可以做到这一点?我使用的 npm 包是 react-chartjs-2。它有 2 个道具,我发现它们可能会有所帮助,但在这种情况下不知道如何使用它。它们是getElementsAtEvent和onElementsClick。这些道具在使用时会提供大量数据,除了我刚刚单击的栏的值。
这就是我导入组件的方式
import { Bar } from "react-chartjs-2";
这就是我使用组件的方式
<Bar
data={barData}
height={275}
options={{
maintainAspectRatio: false,
scales: {
yAxes: [
{
ticks: {
beginAtZero: true,
},
},
],
},
}}
/>;
而变量barData如下:
const barData = {
labels: [
"04-07-2020",
"05-07-2020",
"06-07-2020",
"07-07-2020",
"08-07-2020",
"09-07-2020",
"10-07-2020",
],
datasets: [
{
label: "Cases",
borderWidth: 1,
backgroundColor: "#ffc299",
borderColor: "#cc5200",
hoverBackgroundColor: "#ed873e",
hoverBorderColor: "#e35f00",
data: [673165, 697413, 719664, 742417, 767296, 793802, 820916],
},
{
label: "Recovered",
borderWidth: 1,
backgroundColor: "#b3ffb3",
borderColor: "#00ff00",
hoverBackgroundColor: "#55cf72",
hoverBorderColor: "#2c9c46",
data: [409083, 424433, 439934, 456831, 476378, 495513, 515386],
},
{
label: "Deaths",
borderWidth: 1,
backgroundColor: "#de8078",
borderColor: "#fa6457",
hoverBackgroundColor: "#d73627",
hoverBorderColor: "#ff4636",
data: [19268, 19693, 20159, 20642, 21129, 21604, 22123],
},
],
};
这是图表

 富国沪深
富国沪深3回答
-

宝慕林4294392
由于您的数据是以某种方式构建的,因此当单击某个条形时,将返回一个大小为 3 的数组,即elem. 您可以根据需要从那里提取数据。使用onElementsClick:<Bar data={barData} height={275} onElementsClick={elem => { var data = barData.datasets[elem[0]._datasetIndex].data; console.log("Cases", data[elem[0]._index]); data = barData.datasets[elem[1]._datasetIndex].data; console.log("Recovered", data[elem[1]._index]); data = barData.datasets[elem[2]._datasetIndex].data; console.log("Deaths", data[elem[2]._index]); }} options={{ maintainAspectRatio: false, scales: { yAxes: [ { ticks: { beginAtZero: true, }, }, ], }, }}/>;elem填充有单击的元素。您可能需要稍微调整此代码,以根据您要对该数据执行的操作来准确实现您正在寻找的内容。评论中的沙盒。 -

呼唤远方
onClick您可以在图表选项中定义一个函数。onClick: (event, elements) => { const chart = elements[0]._chart; const element = chart.getElementAtEvent(event)[0]; const dataset = chart.data.datasets[element._datasetIndex]; const xLabel = chart.data.labels[element._index]; const value = dataset.data[element._index]; console.log(dataset.label + " at " + xLabel + ": " + value);}请在下面的StackBlitz中查看您修改后的代码。 -

LEATH
看来,onElementsClick 在 chart-js-2 ver.>3 中已被弃用 你猫试试这个:<Bar data={data} options={options} getElementAtEvent={(elements, event) => { if (event.type === "click" && elements.length) { console.log(elements[0]); } }}/>
 随时随地看视频慕课网APP
相关分类


 JavaScript