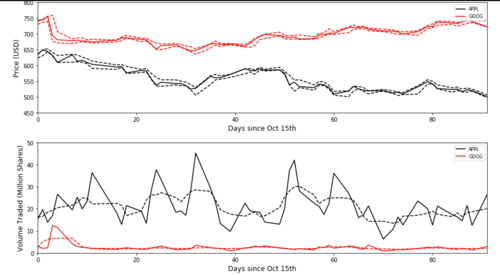
在子图中写一段文字
我正在研究这个情节:

我需要在第一个图内写一些东西,在红线和黑线之间,我尝试过,ax1.text()但它显示了两个图之间的文本,而不是第一个图内的文本。我怎样才能做到这一点?
情节是这样安排的:
fig, (ax1,ax2) = plt.subplots(nrows=2, ncols=1, figsize = (12,7), tight_layout = True)
预先感谢您的帮助!
 沧海一幻觉
沧海一幻觉浏览 174回答 1
1回答
-

蓝山帝景
没有更多的代码细节,很难猜出哪里出了问题。matplotlib.axes.Axes.text可以很好地在子图上显示文本框。我鼓励您查看文档(参数...)并自己尝试。文本位置基于以下 2 个参数:transform=ax.transAxes: 表示坐标是相对于坐标轴边界框给出的,坐标轴(0, 0)的左下角和(1, 1)右上角。text(x, y,...): where x,y是放置文本的位置。可以使用以下参数更改坐标系transform。这是一个例子:# import modulesimport matplotlib.pyplot as pltimport numpy as np# Create random datax = np.arange(0,20)y1 = np.random.randint(0,10, 20)y2 = np.random.randint(0,10, 20) + 15# Create figurefig, (ax1,ax2) = plt.subplots(nrows=2, ncols=1, figsize = (12,7), tight_layout = True)# Add subplotsax1.plot(x, y1)ax1.plot(x, y2)ax2.plot(x, y1)ax2.plot(x, y2)# Show textsax1.text(0.1, 0.5, 'Begin text', horizontalalignment='center', verticalalignment='center', transform=ax1.transAxes)ax2.text(0.9, 0.5, 'End text', horizontalalignment='center', verticalalignment='center', transform=ax2.transAxes)plt.show()输出
 随时随地看视频慕课网APP
相关分类

 Python