xx 格式科学风格 y-ticks matplotlib
我正在使用 matplotlib 创建一些图。
对于我使用的地块style='sci'与scilimits=(0,0)
这是代码:
for key in urbs_values.keys():
# y-Axis (values)
u[key] = np.array(urbs_values[key])
o[key] = np.array(oemof_values[key])
# draw plots
plt.plot(i, u[key], label='urbs_'+str(key), linestyle='None', marker='x')
plt.ticklabel_format(axis='y', style='sci', scilimits=(0, 0))
plt.plot(i, o[key], label='oemof_'+str(key), linestyle='None', marker='.')
plt.ticklabel_format(axis='y', style='sci', scilimits=(0, 0))
这通常是一致的,但有时我会在格式中获取 y 轴上的值x.x,有时我会得到x.xx,但我并不觉得它很优雅。
有没有办法强制 matplotlib 以一种格式始终为我提供 y 值,例如x.x通过动态缩放科学符号?
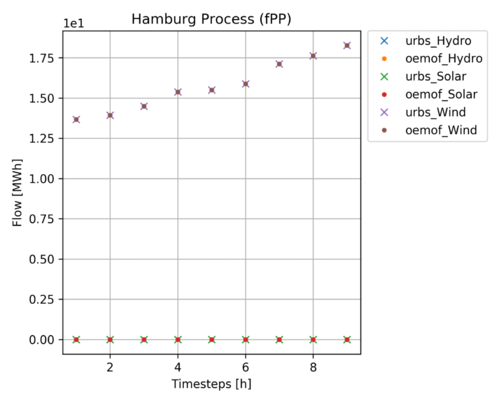
这是我不喜欢的示例图:

 慕娘9325324
浏览 207回答 1
1回答
-

慕森王
您可以根据数据中的最大值动态设置限制:def grabMaxExponent(values, precision=1): """Given a list of numericals, returns the exponent of the max value in scientific notation, adjusted to have no sig figs in decimal places. e.g. 190 > 1.9E+02 > 19E+01 returns exponent (1)""" # Grab max value and convert to scientific notation value = format(max(values), f"5.{precision}E") # Pull exponent a,m = value.split('E+') a,b = a.split('.') a,b,m = map(int, (a,b,m)) # If significant figures non-zero, increase exponent to bring them before decimal point if b > 0: m-=precision return mm = grabMaxExponent(y)# Set scilimits to mplt.ticklabel_format(axis='y', style='sci', scilimits=(m,m))https://matplotlib.org/api/_as_gen/matplotlib.axes.Axes.ticklabel_format.html
 随时随地看视频慕课网APP
相关分类

 Python