如何设置条形图悬停以显示 x 轴的标签?
我已经生成了一个简单的条形图。为了使其更具交互性,我在图表中添加了 Hovertool。
from bokeh.io import show, output_notebook
from bokeh.plotting import figure, output_file
from bokeh.models.glyphs import HBar
from bokeh.models import ColumnDataSource, Legend, HoverTool
output_notebook()
# Set x and y
functions = ['func_1', 'func_2', 'func_3']
percentage = [233.14, 312.03, 234.00]
# Set data source (color needs to be set precisely with len(category))
source = ColumnDataSource(data=dict(functions=functions, percentage=percentage))
# Set the x_range to the list of categories above
p = figure(x_range=functions, plot_height=600, plot_width=800, title="The Overall Use of my functions",
x_axis_label='Functions', y_axis_label='Percentage')
# Categorical values can also be used as coordinates
p.vbar(x='functions', top='percentage', width=0.9, source=source)
p.add_tools(HoverTool(tooltips=[('Percentage', "@percentage")]))
show(p)
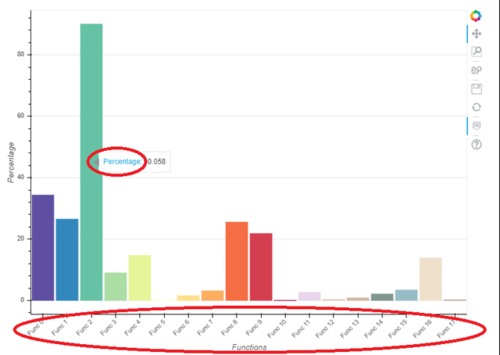
虽然它正确显示了 y 轴的值,但我想显示 x 轴的标签(例如,Func1:9.45)。就像链接中显示的图片一样(我还不能发布图片):

更新#1 我试图想出一些东西,这就是我得到的:
# Set Hover
percentage = list(map(lambda i: str(i), percentage))
my_hover = list(zip(functions, percentage))
p.add_tools(HoverTool(tooltips=my_hover))
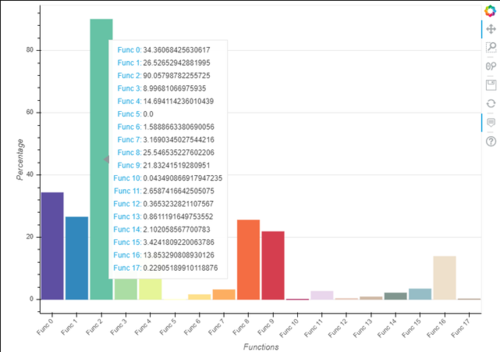
事实证明它显示了每个条中的每个细节,如下所示

 慕码人2483693
1回答
-

HUWWW
此代码适用于 Bokeh v1.0.4。import mathimport numpy as npimport pandas as pdfrom bokeh.models import ColumnDataSource, HoverToolfrom bokeh.plotting import figure, showfrom bokeh.palettes import Category10df = pd.DataFrame(data = np.random.rand(10, 1), columns = ['percentage'], index = ['Func {}'.format(nmb) for nmb in range(10)])df['color'] = Category10[10]source = ColumnDataSource(data = dict(functions = df.index.values, percentage = df['percentage'].values, color = df['color'].values))p = figure(x_range = df.index.values, plot_height = 600, plot_width = 800, title = "The Overall Use of my functions", x_axis_label = 'functions', y_axis_label = 'percentage')p.vbar(x = 'functions', top = 'percentage', width = 0.9, color = 'color', source = source)p.add_tools(HoverTool(tooltips = '<font color=blue>@functions:</font><font color=red> @percentage</font>'))p.xgrid.grid_line_color = Nonep.xaxis.major_label_orientation = math.pi / 4 # Rotate axis' labelsshow(p)结果:
 随时随地看视频慕课网APP
相关分类

 Python