在 django 中显示 d3 图表
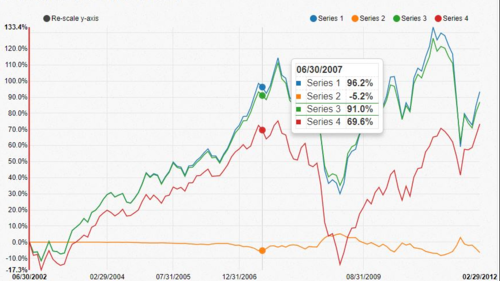
我正在浏览图书馆 NVD3 并在网站上找到了这个例子:
d3.json('cumulativeLineData.json', function(data) {
nv.addGraph(function() {
var chart = nv.models.cumulativeLineChart()
.x(function(d) { return d[0] })
.y(function(d) { return d[1]/100 }) //adjusting, 100% is 1.00, not 100 as it is in the data
.color(d3.scale.category10().range())
.useInteractiveGuideline(true)
;
chart.xAxis
.tickValues([1078030800000,1122782400000,1167541200000,1251691200000])
.tickFormat(function(d) {
return d3.time.format('%x')(new Date(d))
});
chart.yAxis
.tickFormat(d3.format(',.1%'));
d3.select('#chart svg')
.datum(data)
.call(chart);
//TODO: Figure out a good way to do this automatically
nv.utils.windowResize(chart.update);
return chart;
});
});
图像是这样的:

现在我愿意在 django 示例中包含这样的图表。所以我继续检查Django-NVD3的实现。但是我找不到任何与之相关的内容,而且我不理解作者编写的文档。
请让我知道如何在 django 框架中实时包含 d3 图表。
 慕田峪4524236
1回答
 随时随地看视频慕课网APP
相关分类
 Python