简单示例中的错误逻辑回归
我正在尝试使用一个简单的逻辑回归示例 sklearn.linear_model.LogisticRegression
这是代码:
import pandas as pd
import numpy as np
import matplotlib.pyplot as plt
import seaborn as sns
from sklearn.linear_model import LogisticRegression
from sklearn import metrics
# some randomly generated data with two well differentiated groups
x1 = np.random.normal(loc=15, scale=2, size=(30,1))
y1 = np.random.normal(loc=10, scale=2, size=(30,1))
x2 = np.random.normal(loc=25, scale=2, size=(30,1))
y2 = np.random.normal(loc=20, scale=2, size=(30,1))
data1 = np.concatenate([x1, y1, np.zeros(shape=(30,1))], axis=1)
data2 = np.concatenate([x2, y2, np.ones(shape=(30,1))], axis=1)
dfa = pd.DataFrame(data=data1, columns=["F1", "F2", "group"])
dfb = pd.DataFrame(data=data2, columns=["F1", "F2", "group"])
df = pd.concat([dfa, dfb], ignore_index=True)
# the actual fitting
features = [item for item in df.columns if item not in ("group")]
logreg = LogisticRegression(verbose=1)
logreg.fit(df[features], df.group)
# plotting and checking the result
theta = logreg.coef_[0,:] # parameters
y0 = logreg.intercept_ # intercept
print("Theta =", theta)
print("Intercept = ", y0)
xdb = np.arange(0, 30, 0.2) # dummy x vector for decision boundary
ydb = -(y0+theta[0]*xdb) / theta[1] # decision boundary y values
fig = plt.figure()
ax = fig.add_subplot(111)
colors = {0 : "red", 1 : "blue"}
for i, group in df.groupby("group"):
plt.plot(group["F1"], group["F2"],
MarkerFaceColor = colors[i], Marker = "o", LineStyle="",
MarkerEdgeColor=colors[i])
plt.plot(xdb, ydb, LineStyle="--", Color="b")
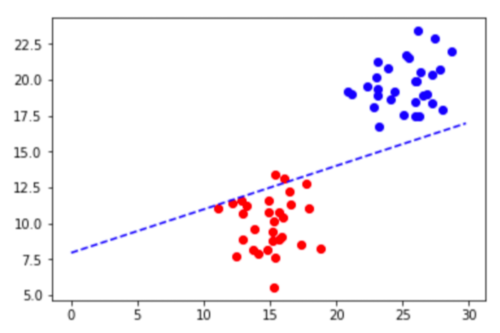
令人震惊的是,结果图如下所示:

事实上,准确度可以计算为:
predictions = logreg.predict(df[features])
metrics.accuracy_score(predictions, df["group"])
结果是 0.966...
我一定是做错了什么,只是想不通是什么。任何帮助深表感谢!
 杨__羊羊
杨__羊羊1回答
-

慕慕森
这是由于正则化。线的最佳值是截距值约为 -16,但由于正则化,它无法达到该水平。Logistic 回归最小化损失函数,即误差和权重值的组合。在这种情况下,当我们增加 C 模型的值时,将更多地关注减少错误(从而找到更好的决策边界)而不是权重。结果在适当的决策边界。尽管正则化在大多数现实世界场景中非常重要。在某些情况下,重要的是不要使用一个。进行以下更改logreg = LogisticRegression(verbose=1, C=100)输出如下阅读有关正则化的更多信息以更好地理解这一点
 随时随地看视频慕课网APP
相关分类

 Python