如何在chartjs2中绘制一条不同颜色的线?

我需要绘制一张看起来像图片上的图表。我如何使用chartjs2做到这一点?不幸的是,我找不到任何展示如何实现它的示例。
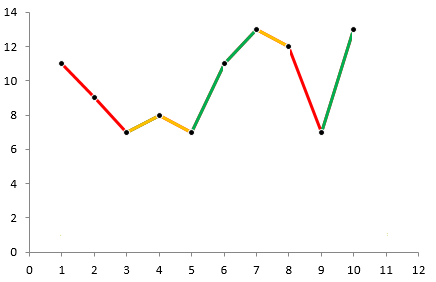
http://img.mukewang.com/60cc5329000108e004360282.jpg


一只甜甜圈
浏览 235回答 2
2回答

慕后森

在 React 中是这样写的 2 行:<Line&nbsp; &nbsp; data={{&nbsp; &nbsp; &nbsp; labels: [100, 200, 300, 150, 250, 400],&nbsp; &nbsp; &nbsp; datasets: [&nbsp; &nbsp; &nbsp; &nbsp; {&nbsp; &nbsp; &nbsp; &nbsp; &nbsp; label: 'My red line',&nbsp; &nbsp; &nbsp; &nbsp; &nbsp; fill: false,&nbsp; &nbsp; &nbsp; &nbsp; &nbsp; borderColor: 'red',&nbsp; &nbsp; &nbsp; &nbsp; &nbsp; data: [null, null, 2, 0, 3],&nbsp; &nbsp; &nbsp; &nbsp; },&nbsp; &nbsp; &nbsp; &nbsp; {&nbsp; &nbsp; &nbsp; &nbsp; &nbsp; label: 'My green line',&nbsp; &nbsp; &nbsp; &nbsp; &nbsp; fill: false,&nbsp; &nbsp; &nbsp; &nbsp; &nbsp; borderColor: 'green',&nbsp; &nbsp; &nbsp; &nbsp; &nbsp; data: [2, 4, 2, null, null, null],&nbsp; &nbsp; &nbsp; &nbsp; },&nbsp; &nbsp; &nbsp; ],&nbsp; &nbsp; }}&nbsp; />
打开App,查看更多内容
随时随地看视频慕课网APP

相关分类

JavaScript