如何使用ggplot2上的标识控制堆积条形图的顺序
使用这个假人 data.frame
ts <- data.frame(x=1:3, y=c("blue", "white", "white"), z=c("one", "one", "two"))
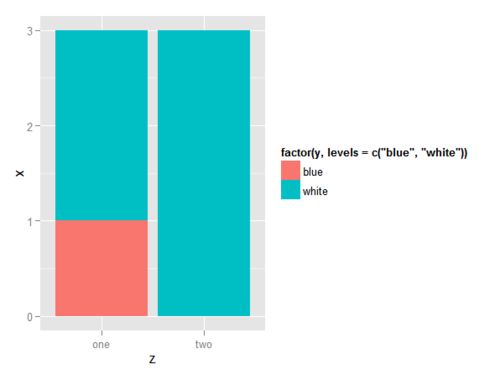
我尝试在顶部绘制“蓝色”类别。
ggplot(ts, aes(z, x, fill=factor(y, levels=c("blue","white" )))) + geom_bar(stat = "identity")

在上面给我“白色”。和
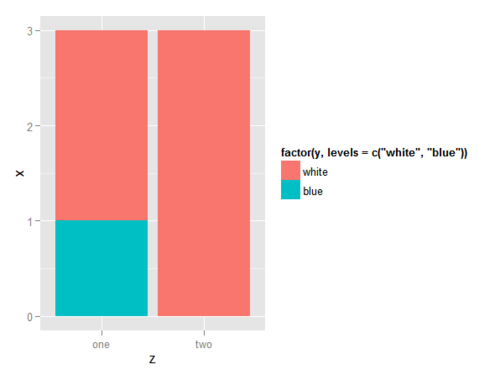
ggplot(ts, aes(z, x, fill=factor(y, levels=c("white", "blue")))) + geom_bar(stat = "identity")

反转颜色,但顶部仍给我“白色”。我怎样才能在顶部获得“蓝色”?
 米脂
米脂浏览 4616回答 3
3回答
-

幕布斯6054654
group在ggplot()通话中使用美感。这样可以确保所有层以相同的方式堆叠。series <- data.frame( time = c(rep(1, 4),rep(2, 4), rep(3, 4), rep(4, 4)), type = rep(c('a', 'b', 'c', 'd'), 4), value = rpois(16, 10))ggplot(series, aes(time, value, group = type)) + geom_col(aes(fill = type)) + geom_text(aes(label = type), position = "stack")
 随时随地看视频慕课网APP

 R语言
R语言