ggplot2两行带有表达式的标签
我想用一条expression()语句在两行上写一个轴标签。但是,plotmath并且expression也不允许这样做(例如,在最右边显示带下标的文本)。我在2005年左右发现了类似问题的讨论,但是他们提供的解决方案并没有转化为ggplot2中的我的应用程序。最近的一个问题解决了多行表达式语句的其他排列问题,但是同样,此处提供的解决方法也不适用。
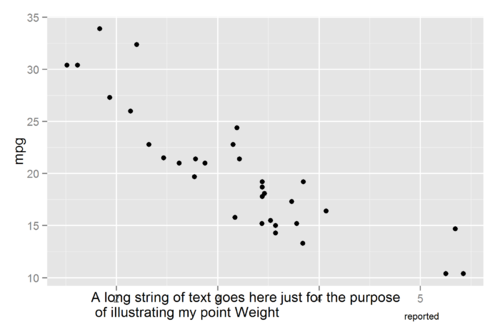
例:
p <- ggplot(mtcars,aes(x=wt,y=mpg))+
geom_point()+
xlab(expression(paste("A long string of text goes here just for the purpose \n of illustrating my point Weight "[reported])))
try(ggsave(plot=p,filename=<some file>,height=4,width=6))
产生一个图像,当我希望下标“ reported”位于前一个单词的旁边时,该图像会被踢到右侧。
 慕尼黑5688855
浏览 1741回答 3
3回答
-

大话西游666
你可以用这个把戏library(gridExtra)library(grid)element_custom <- function() { structure(list(), class = c("element_custom", "element_text"))}element_grob.element_custom <- function(element, label="", ...) { mytheme <- ttheme_minimal(core = list(fg_params = list(parse=TRUE, hjust=0, x=0.1))) disect <- strsplit(label, "\\n")[[1]] tableGrob(as.matrix(disect), theme=mytheme)}# default method is unreliableheightDetails.gtable <- function(x) sum(x$heights)ggplot(iris, aes(Sepal.Length, Sepal.Width)) + geom_line() + labs(x= "First~line \n italic('and a second') \n integral(f(x)*dx, a, b)")+ (theme_grey() %+replace% theme(axis.title.x = element_custom()))

 R语言
R语言