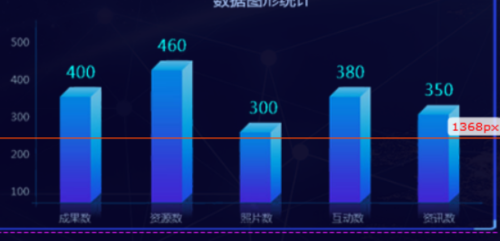
大数据展示,关于立体的柱状图,效果实现,

这样的坐标是2d的,图型是3d的统计图用的是用的那种插件,希望大神能提供个思路,我知道的echarts和highcharts、chart.js好像做不出来(或者给柱子上个背景?)
 corner_sun
浏览 9861回答 4
4回答
-

温迪me
custom组合型:var MyCubeRect = echarts.graphic.extendShape({ shape: { x: 0, y: 0, width: 48, //柱宽 zWidth: 8, //阴影折角宽 zHeight: 4, //阴影折角高 }, buildPath: function (ctx, shape) { const api = shape.api; const xAxisPoint = api.coord([shape.xValue, 0]); const p0 = [shape.x, shape.y]; const p1 = [shape.x - 24, shape.y]; const p4 = [shape.x + 24, shape.y]; const p2 = [xAxisPoint[0] - 24, xAxisPoint[1]]; const p3 = [xAxisPoint[0] + 24, xAxisPoint[1]]; ctx.moveTo(p0[0], p0[1]); //0 ctx.lineTo(p1[0], p1[1]); //1 ctx.lineTo(p2[0], p2[1]); //2 ctx.lineTo(p3[0], p3[1]); //3 ctx.lineTo(p4[0], p4[1]); //4 ctx.lineTo(p0[0], p0[1]); //0 ctx.closePath(); } }); var MyCubeShadow = echarts.graphic.extendShape({ shape: { x: 0, y: 0, width: 48, zWidth: 8, zHeight: 4, }, buildPath: function (ctx, shape) { const api = shape.api; const xAxisPoint = api.coord([shape.xValue, 0]); const p0 = [shape.x, shape.y]; const p1 = [shape.x - 24, shape.y]; const p4 = [shape.x + 24, shape.y]; const p6 = [shape.x + 24 + 8, shape.y - 4]; const p7 = [shape.x - 24 + 8, shape.y - 4]; const p3 = [xAxisPoint[0] + 24, xAxisPoint[1]]; const p5 = [xAxisPoint[0] + 24 + 8, xAxisPoint[1] - 4]; ctx.moveTo(p4[0], p4[1]); //4 ctx.lineTo(p3[0], p3[1]); //3 ctx.lineTo(p5[0], p5[1]); //5 ctx.lineTo(p6[0], p6[1]); //6 ctx.lineTo(p4[0], p4[1]); //4 ctx.moveTo(p4[0], p4[1]); //4 ctx.lineTo(p6[0], p6[1]); //6 ctx.lineTo(p7[0], p7[1]); //7 ctx.lineTo(p1[0], p1[1]); //1 ctx.lineTo(p4[0], p4[1]); //4 ctx.closePath(); } }); echarts.graphic.registerShape('MyCubeRect', MyCubeRect); echarts.graphic.registerShape('MyCubeShadow', MyCubeShadow); option = { grid: { height: 300 }, xAxis: { data: ['one', 'two'] }, yAxis: { type: 'value' }, series: [{ type: 'custom', renderItem: function (params, api) { let location = api.coord([api.value(0), api.value(1)]); return { type: 'group', children: [{ type: 'MyCubeRect', shape: { api, xValue: api.value(0), yValue: api.value(1), x: location[0], y: location[1] }, style: { fill: '#5AD8A6' } },{ type: 'MyCubeShadow', shape: { api, xValue: api.value(0), yValue: api.value(1), x: location[0], y: location[1] }, style: { fill: '#2DCF8E' } }] }; }, data: [20, 60] }] }; -

温迪me
// custom var MyCube = echarts.graphic.extendShape({ shape: { x: 0, y: 0, width: 48, //柱宽 zWidth: 8, //阴影折角宽 zHeight: 4, //阴影折角高 }, buildPath: function (ctx, shape) { const api = shape.api; const xAxisPoint = api.coord([shape.xValue, 0]); const p0 = [shape.x, shape.y]; const p1 = [shape.x - 24, shape.y]; const p4 = [shape.x + 24, shape.y]; const p6 = [shape.x + 24 + 8, shape.y - 4]; const p7 = [shape.x - 24 + 8, shape.y - 4]; const p2 = [xAxisPoint[0] - 24, xAxisPoint[1]]; const p3 = [xAxisPoint[0] + 24, xAxisPoint[1]]; const p5 = [xAxisPoint[0] + 24 + 8, xAxisPoint[1] - 4]; ctx.moveTo(p0[0], p0[1]); //0 ctx.lineTo(p1[0], p1[1]); //1 ctx.lineTo(p2[0], p2[1]); //2 ctx.lineTo(p3[0], p3[1]); //3 ctx.lineTo(p4[0], p4[1]); //4 ctx.lineTo(p0[0], p0[1]); //0 ctx.moveTo(p4[0], p4[1]); //4 ctx.lineTo(p3[0], p3[1]); //3 ctx.lineTo(p5[0], p5[1]); //5 ctx.lineTo(p6[0], p6[1]); //6 ctx.lineTo(p4[0], p4[1]); //4 ctx.moveTo(p4[0], p4[1]); //4 ctx.lineTo(p6[0], p6[1]); //6 ctx.lineTo(p7[0], p7[1]); //7 ctx.lineTo(p1[0], p1[1]); //1 ctx.lineTo(p4[0], p4[1]); //4 ctx.closePath();; }}); echarts.graphic.registerShape('myCubeShape', MyCube); option = { grid: { height: 300 }, xAxis: { data: ['one', 'two'] }, yAxis: { type: 'value' }, series: [{ type: 'custom', renderItem: function (params, api) { let location = api.coord([api.value(0), api.value(1)]); return { type: 'myCubeShape', shape: { api, xValue: api.value(0), yValue: api.value(1), x: location[0], y: location[1] }, style: { fill: '#5AD8A6' } }; }, data: [20, 60] } ]};展示效果: -

Nyears
个人觉得可以用html画图结合css3 2d+3d;当然不排除有更好的插件,只是本人没用过 -

慕容6357965
我和你做的是一样的图,我用的是echarts
 随时随地看视频慕课网APP
相关分类


 JavaScript
 Html5
Html5
 大数据
大数据