Python 加点坐标有大神能不能帮一下
import numpy as np
import pandas as pd
import matplotlib.pyplot as plt
%matplotlib inline
data = pd.read_csv("/resources/data/zr.csv") #导入文件
by_year = data.groupby(["Year description"]).size()
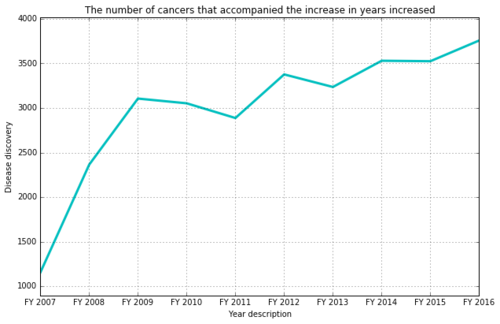
by_year.plot(kind = "line",alpha=1,figsize = [10,7],color = 'c',\
title = "The number of cancers that accompanied the increase in years increased",\
linewidth=3)
plt.ylabel("Disease discovery")
plt.grid(True) #加上校准线
plt.subplots_adjust(bottom=0.2) #设置图像高度
plt.margins(0.1) #居中显示图像
#for a, b in zip():
#plt.text()
#有没有大神会在这两行加上每一年的点坐标
 Zr_0118
浏览 1357回答 0
0回答
相关分类
 JavaScript
 Java
Java
 Python