我无法根据三个标准用 networkx 形成图表
我是Python新手。请帮我解决图形构建的问题。我有一个属性为“来源”、“对话者”和“频率”的数据库。
三行的示例:
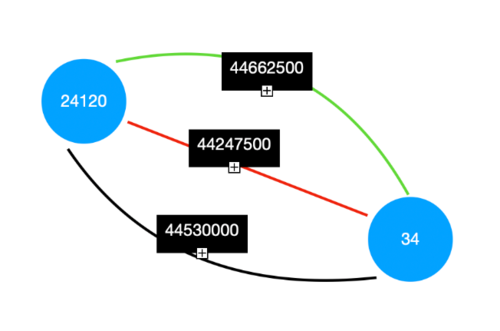
我需要基于源对话者构建一个图表,但也考虑了频率。
像这样:
我的代码:
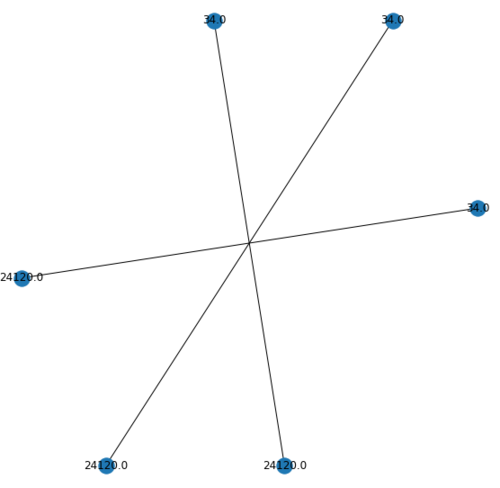
dic_values={Source:[24120.0,24120.0,24120.0], Interlocutor:[34,34,34],Frequency:[446625000, 442475000, 445300000]
session_graph=pd.DataFrame(dic_values)
friquency=session_graph['Frequency'].unique()
plt.figure(figsize=(10,10))
for i in range(len(friquency)):
df_friq=session_subset[session_subset['Frequency']==friquency[i]]
G_frique=nx.from_pandas_edgelist(df_friq,source='Source',target='Interlocutor')
pos = nx.spring_layout(G_frique)
nx.draw_networkx_nodes(G_frique, pos, cmap=plt.get_cmap('jet'), node_size = 20)
nx.draw_networkx_edges(G_frique, pos, arrows=True)
nx.draw_networkx_labels(G_frique, pos)
plt.show()
我有这样的:
浏览 211回答 1
1回答
-
慕沐林林
你的问题需要一个MultiGraphimport networkx as nximport matplotlib.pyplot as pltimport pandas as pdimport pydotfrom IPython.display import Imagedic_values = {"Source":[24120.0,24120.0,24120.0], "Interlocutor":[34,34,34], "Frequency":[446625000, 442475000, 445300000]}session_graph = pd.DataFrame(dic_values)sources = session_graph['Source'].unique()targets = session_graph['Interlocutor'].unique()#create a Multigraph and add the unique nodesG = nx.MultiDiGraph()for n in [sources, targets]: G.add_node(n[0]) #Add edges, multiple connections between the same set of nodes okay. # Handled by enum in Multigraph #Itertuples() is a faster way to iterate through a Pandas dataframe. Adding one edge per rowfor row in session_graph.itertuples(): #print(row[1], row[2], row[3]) G.add_edge(row[1], row[2], label=row[3]) #Now, render it to a file...p=nx.drawing.nx_pydot.to_pydot(G)p.write_png('multi.png')Image(filename='multi.png') #optional 这将产生以下结果:请注意,当您使用 Graphviz/Pydot 时,节点布局会更加棘手。00
相关分类