-

- 慕雪6105537 2024-07-29
张三
- 0赞 · 0采集
-
- 慕雪6105537 2024-07-29
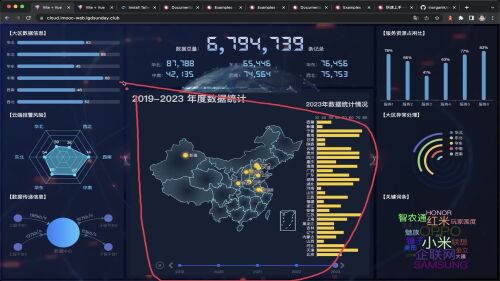
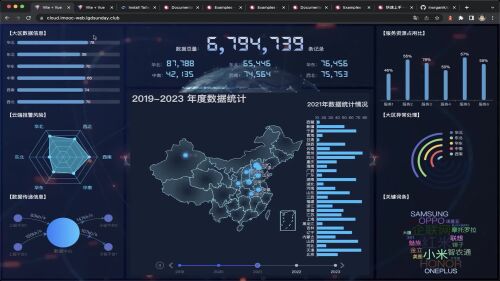
统计数据
- 0赞 · 0采集
-

- 叶0528 2023-12-29
#479AD3
HorizontalBar.vue
<template> <div> <div>【大区数据信息】</div> <div ref="target" class="w-full h-full"></div> </div> </template> <script setup> import { ref, onMounted, watch } from "vue"; import * as echarts from "echarts"; const props = defineProps({ data: { type: Object, required: true } }); console.log("横向柱状图", props.data); // 1. 初始化echarts实例 let mChart = null; const target = ref(null); onMounted(() => { mChart = echarts.init(target.value); renderChart(); }); // 2. 构建option配置对象 const renderChart = () => { console.log("renderChart---"); const options = { // X轴展示数据 xAxis: { show: false, type: "value", max: function(value) { return parseInt(value.max * 1.2); } }, // Y轴展示数据 yAxis: { type: "category", data: props.data.regions.map(item => item.name), inverse: true, axisLine: { show: false }, axisTick: { show: false }, axisLabel: { //y轴文字的配置 color: "#88f1ff", textStyle: { color: "white" //Y轴内容文字颜色 } } }, // 图表绘制的位置,对应 上下左右 grid: { top: 0, right: 0, bottom: 0, left: 0, containLabel: true }, //核心配置 series: [ { type: "bar", data: props.data.regions.map(item => ({ name: item.name, value: item.value })), showBackground: true, backgroundStyle: { color: "rgba(180,180,180,0.2)" }, itemStyle: { color: "#479AD3", barBorderRadius: 5, shadowColor: "rgba(0,0,0,0.3)", shadowBlur: 5 }, barWidth: 12, label: { show: true, position: "right", textStyle: { color: "#fff" } } } ] }; // 3.通过实例.setOptions(option) if (mChart != null) { mChart.setOption(options); } }; watch( () => props.data, () => { renderChart(); } ); </script> <style lang="scss" scoped> </style>- 0赞 · 0采集
-

- 小鱼0319zn 2023-11-24
学习拉,学习拉,抓紧学习哦
- 0赞 · 0采集
-

- 慕先生5153271 2023-11-10
- 数据可视化平台技术
VITE+VUE - 0赞 · 0采集
-

- 我爱学习吖 2023-10-20
使用tailwindcss都不用自己写css样式了啊,熟悉已有的类名就行。不过这应该是针对小型项目,练手项目,没有自己组件库的情况使用吧
- 0赞 · 0采集
-

- wuchunuan 2023-09-25
- 测试下
测试一下就是这个价 - 0赞 · 0采集
-

- 慕桂英2278230 2023-08-30
我的一天

- 0赞 · 0采集
-
- 慕桂英2278230 2023-08-30
我的问题
- 0赞 · 0采集


数据加载中...
开始学习
免费