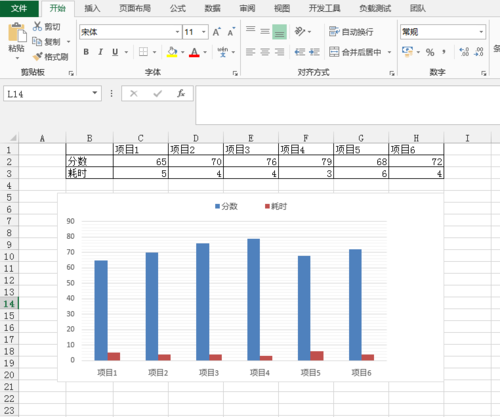
本文以Java示例介绍如何在Excel中添加趋势线,以及读取趋势线公式。通过文中的方法可支持添加6种不同类型的趋势线,包括Linear、Exponential、Logarithmic、Moving Average、Polynomial、Power等;读取趋势线时可读取趋势线类型、名称、公式等。
代码程序环境要求:
Spire.xls.jar(这里用免费版的就可以了)
Jdk 1.8.0 (jdk版本要求1.6.0及以上就可以)
IDEA
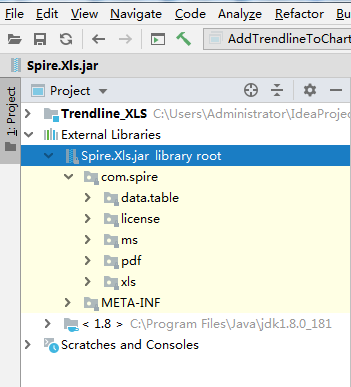
其中,jard导入可参考如下两种方法(任选其一):
1. 下载免费版jar包Free Spire.XLS for Java,手动导入jar到Java程序。Jar文件在解压文件中的lib文件夹下获取。
2. Maven程序中,通过配置pom.xml文件,指定maven仓库路径及spire.xls.free的依赖(同时注意版本号是否正确),如下:
<repositories>
    <repository>
      <id>com.e-iceblue</id>
      <url>http://repo.e-iceblue.cn/repository/maven-public/</url>
       </repository></repositories>
       <dependencies><dependency>
<groupId>e-iceblue</groupId>
    <artifactId>spire.xls.free</artifactId>
    <version>3.9.1</version>
   </dependency>
</dependencies>
完成配置后,导入jar到程序。
Eclipse中导入jar步骤略有不同。
jar导入效果:
Java 代码示例
1. 添加趋势线
 import com.spire.xls.*;
 import com.spire.xls.core.IChartTrendLine;

 import java.awt.*;

 public class AddTrendlineToChart {
     public static void main(String[] args) {
         //加载Excel文档
         Workbook wb = new Workbook();
         wb.loadFromFile("test.xlsx");

         //获取第一个工作表中的第一个图表
         Chart chart0 = wb.getWorksheets().get(0).getCharts().get(0);

         //给图表的第一个数据系列添加趋势线(支持Linear、Exponential、Logarithmic、Moving_Average、Polynomial、Power等6种类型)
         IChartTrendLine trendLine0 = chart0.getSeries().get(0).getTrendLines().add(TrendLineType.Linear);
         trendLine0.setName("Linear(Series1)");//趋势线的名称
         trendLine0.getBorder().setPattern(ChartLinePatternType.DashDot);//趋势线的线条类型
         trendLine0.getBorder().setColor(new Color(255,69,0));//趋势线的线条颜色
         trendLine0.setForward(0.5);//趋势线向前和向后延伸的单位数
         trendLine0.setBackward(0.5);
         trendLine0.setIntercept(5);//趋势线的截距
         trendLine0.setDisplayEquation(true);//显示公式
         trendLine0.setDisplayRSquared(true);//显示R平方值

         //保存文档
         wb.saveToFile("AddTrendline.xlsx", ExcelVersion.Version2013);
         wb.dispose();
     }
 }
趋势线添加效果:

2. 读取趋势线
import com.spire.xls.*;
import com.spire.xls.core.IChartTrendLine;
public class ReadTrendline {
public static void main(String[] args) {
//加载Excel文档
Workbook workbook = new Workbook();
workbook.loadFromFile("AddTrendline.xlsx");
//获取第一个工作表中的第一个图表
Chart chart = workbook.getWorksheets().get(0).getCharts().get(0);
//获取图表的第一个数据系列的趋势线
IChartTrendLine trendLine = chart.getSeries().get(0).getTrendLines().get(0);
String type = trendLine.getType().toString();
String name = trendLine.getName();
String equation = trendLine.getFormula();
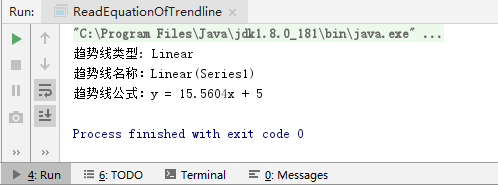
System.out.println("趋势线类型: "+ type + "\n"
+ "趋势线名称:" + name + "\n"
+ "趋势线公式:" + equation);
}
}趋势线读取结果:
3. 删除图表中的趋势线
import com.spire.xls.*;

 public class RemoveTrendline {
     public static void main(String[] args) {
         //加载Excel文档
         Workbook workbook = new Workbook();
         workbook.loadFromFile("AddTrendline.xlsx");

         //获取第一个工作表中的第一个图表
         Chart chart = workbook.getWorksheets().get(0).getCharts().get(0);

         //删除图表中的趋势线
         chart.getSeries().get(0).getTrendLines().removeAt(0);

         //保存文档
         workbook.saveToFile("result.xlsx",FileFormat.Version2013);
         workbook.dispose();
     }
 }
趋势线删除结果: