(1) 二分Kmeans算法简介:
二分KMeans(Bisecting KMeans)是基于KMeans算法之上,KMeans聚类结果易受到初始聚类中心点选择的影响。如果不需要选取初始值呢。二分KMeans克服初始中心点影响,各簇中心点的距离较远,这就完全避免了初始聚类中心会选到一个类别上,一定程度上克服了算法陷入局部最优状态。
基本思想:首先将所有点作为一个簇,然后将该簇一分为二,每次选择能最大限度降低聚类代价函数(也就是误差平方和)的簇划分为两个簇(不管是否刚才是否已经分裂过)。以此进行下去,直到簇的数目等于用户给定的数目k为止。那么,如何选择某簇进行分裂呢。那就只能用聚类的性能指标来衡量:误差平方和。搜索当前簇分类,选择分类误差平方和最小的,因为聚类的误差平方和越小表示数据点越接近于他们的质心,聚类效果就越好。
算法流程:
初始化簇表,使之包含由所有的点组成的簇(初始为一簇)。
while(簇数未达到用户指定数目):
从簇表中取出一个簇。
{对选定的簇进行多次二分探试}
for i in range(探试次数):
使用基本k均值,二分选定的簇。
从二分试验中选择具有最小误差的两个簇。
将这两个簇添加到簇表中。
缺点:
二分k均值建立在k均值算法基础之上,相对于传统k均值,复杂度高,需要不断地搜索分类方式,当样本数量大,该方法不太适用。
(2) 二分k均值代码实现:
from numpy import *
import numpy as np
import matplotlib.pyplot as plt
def loadDataSet(fileName): #general function to parse tab -delimitedfloats
dataMat = [] #assume last column is target value
fr = open(fileName)
for line in fr.readlines():
curLine = [float(y) for y inline.strip().split(',')]
dataMat.append(curLine)
return dataMat
def distEclud(vecA, vecB):
return sqrt(sum(power(vecA - vecB, 2))) #la.norm(vecA-vecB)
def randCent(dataSet, k):
n= shape(dataSet)[1]
centroids = mat(zeros((k,n)))#create centroid mat
for j in range(n):#create random cluster centers, within bounds of eachdimension
minJ = min(dataSet[:,j])
rangeJ = float(max(dataSet[:,j]) - minJ)
centroids[:,j] = mat(minJ + rangeJ * random.rand(k,1))
return centroids
def kMeans(dataSet, k, distMeas=distEclud,createCent=randCent):
m= shape(dataSet)[0]
clusterAssment = mat(zeros((m,2)))#create mat to assign data points
#toa centroid, also holds SE of each point
centroids = createCent(dataSet, k)
clusterChanged = True
while clusterChanged:
clusterChanged = False
for i in range(m):#for each data point assign it to the closest centroid
minDist = inf; minIndex = -1
for j in range(k):
distJI =distMeas(centroids[j,:],dataSet[i,:])
if distJI < minDist:
minDist = distJI; minIndex= j
if clusterAssment[i,0] != minIndex: clusterChanged = True
clusterAssment[i,:] = minIndex,minDist**2
print(centroids)
for cent in range(k):#recalculate centroids
ptsInClust = dataSet[nonzero(clusterAssment[:,0].A==cent)[0]]#get allthe point in this cluster
centroids[cent,:] = mean(ptsInClust, axis=0) #assign centroid to mean
return centroids, clusterAssment
def biKmeans(dataSet, k,distMeas=distEclud):
m= shape(dataSet)[0]
clusterAssment = mat(zeros((m,2)))
centroid0 = mean(dataSet, axis=0).tolist()[0]
centList =[centroid0] #create a list with one centroid
for j in range(m):#calc initial Error
clusterAssment[j,1] = distMeas(mat(centroid0), dataSet[j,:])**2
while (len(centList) < k):
lowestSSE = inf
for i in range(len(centList)):
ptsInCurrCluster = dataSet[nonzero(clusterAssment[:,0].A==i)[0],:]#getthe data points currently in cluster i
centroidMat, splitClustAss = kMeans(ptsInCurrCluster, 2, distMeas)
sseSplit = sum(splitClustAss[:,1])#compare the SSE to the currrentminimum
sseNotSplit =sum(clusterAssment[nonzero(clusterAssment[:,0].A!=i)[0],1])
print("sseSplit, and notSplit: ",sseSplit,sseNotSplit)
if (sseSplit + sseNotSplit) < lowestSSE:
bestCentToSplit = i
bestNewCents = centroidMat
bestClustAss =splitClustAss.copy()
lowestSSE = sseSplit + sseNotSplit
bestClustAss[nonzero(bestClustAss[:,0].A == 1)[0],0] = len(centList)#change 1 to 3,4, or whatever
bestClustAss[nonzero(bestClustAss[:,0].A == 0)[0],0] = bestCentToSplit
print('the bestCentToSplit is: ',bestCentToSplit)
print('the len of bestClustAss is: ',len(bestClustAss))
centList[bestCentToSplit] = bestNewCents[0,:].tolist()[0]#replace acentroid with two best centroids
centList.append(bestNewCents[1,:].tolist()[0])
clusterAssment[nonzero(clusterAssment[:,0].A == bestCentToSplit)[0],:]=bestClustAss#reassign new clusters, and SSE
return mat(centList), clusterAssment
# show your cluster only available with 2-Ddata
def showCluster(dataSet, k, centroids,clusterAssment):
numSamples, dim = dataSet.shape
if dim != 2:
print("I can not draw !")
return 1
mark = ['or', 'ob', 'og', 'ok', '^r', '+r', 'sr', 'dr', '<r', 'pr']
if k > len(mark):
print("Sorry!")
return 1
#draw all samples
for i in range(numSamples):
markIndex = int(clusterAssment[i, 0])
plt.plot(dataSet[i, 0], dataSet[i, 1], mark[markIndex])
mark = ['Dr', 'Db', 'Dg', 'Dk', '^b', '+b', 'sb', 'db', '<b', 'pb']
#draw the centroids
for i in range(k):
plt.plot(centroids[i, 0], centroids[i, 1], mark[i], markersize = 12)
plt.show()
if __name__=='__main__':
datMat = mat(loadDataSet('d:\\test.txt'))
myCentList,myNewAssment = biKmeans(datMat,2)
print ("centers:",myCentList,myNewAssment)
(3) 二分k均值应用举例:
测试代码:
import biKmeans as bT
from numpy import *
import time
import matplotlib.pyplot as plt
## step 1: load data
dataSet = []
fileIn = open('d:\\testSet.txt')
for line in fileIn.readlines():
lineArr = line.strip().split('\t')
dataSet.append([float(lineArr[0]), float(lineArr[1])])
## step 2: train
dataSet = mat(dataSet)
k = 4
centroids, clusterAssment =bT.biKmeans(dataSet, k)
## step 3: the result
bT.showCluster(dataSet,k, centroids, clusterAssment)
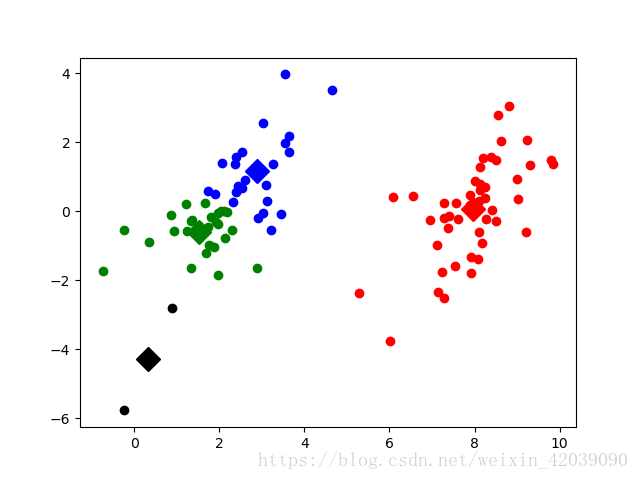
效果如下:

部分代码参考《机器学习实战》源代码。

 随时随地看视频


