- 下面使用请全连接神经网络来对数值任务进行拟合。
- 搭建多层全连接神经网络,通过泰坦尼克号船上乘客的数据进行拟合,预测乘客是否能够在灾难中生存下来。
- 几个简单的全连接神经网络组合在一起,就能够实现强大的预测效果:
1. 载入样本
- 引入"titanic3.csv"数据,数据中记录了泰坦尼克号上乘客的数据。
import numpy as np
import torch
import torch.nn as nn
import torch.nn.functional as F
import os
from scipy import stats
import pandas as pd

titanic_data = pd.read_csv("./titanic3.csv")
print(titanic_data.columns)
运行结果:
- 上述结果显示了泰坦尼克号上乘客的数据属性名称。每个字段具体的含义如下:
- pclass:乘客舱位等级
- survived:是否获救
- name:姓名
- sex:性别
- age:年龄
- sibsp:兄弟姐妹/配偶
- parch:父母/孩子
- ticket:票号
- fare:票价
- cabin:船舱号码
- embarked:登船港(C=瑟堡、Q=昆士顿,S=南安普敦)
- boat:救生艇
- body:身份号码
- home.dest:家庭住址
2. 样本特征分析——离散数据与连续数据
样本的数据特征主要可以分为两类,离散数据特征和连续数据特征。
(1) 离散数据特征
- 离散数据特征类似于分类任务重的标签数据(如男人和女人)所表现出来的特征,即数据之间彼此没有连续性。具有该特征的数据称为离散数据。
在对离散数据做特征变换时,常常将其转化为one-hot编码或者词向量,具体分为两类- 具有固定类别的样本(如性别):处理起来比较容易,可以直接按照总的类别数进行变换。
- 没有固定类别的样本(如名字):可以通过hash算法或类似的散列算法对其处理,然后通过词向量技术进行转换。
(2) 连续数据特征
- 连续数据特征类似回归任务中的标签数据(如年龄)所表现出来的特征,即数据之间彼此具有连续性。
- 具有以上特征的数据称为连续数据。
- 在对连续数据做特征变换时,常对其做对数运算或归一化处理,使其具有统一的值域。
(3) 连续数据与离散数据的相互转化
- 在实际的应用中,需要根据数据的特性选择合适的转化方式,有时还需要实现连续数据与离散数据间的互相转换。
- 例如,在对一个值域跨度很大(如0.1~10000)的特征属性进行数据预处理,可以有以下的3种方法。
- 将其按照最大值,最小值进行归一化处理。
- 对其使用对数运算。
- 按照其分布情况将其分为几类,做离散化处理。
- 具体选择哪种方法还要看数据的分布情况。
- 假设数据中有90%的样本在0.1~1范围内,只有10%的样本在1000-10000范围内,那么使用第一种方法和第二种方法明显不合理,因为这两种方法只会将90%的样本与10%的样本分开,并不能很好地体现出这90%的样本的内部分布情况。
- 而使用第三种方法,可以按照样本在不同区间的分布数量对样本进行分类,让样本内部的分布特征更好的表现出来。
3.处理样本中的离散数据和Nan值
- 使用pandas库中的get_dummies()函数可以将离散数据转成one-hot编码。代码如下:
- 续上述代码
# 用哑变量将指定字段转成one-hot
titanic_data = pd.concat([titanic_data,
                          pd.get_dummies(titanic_data['sex']),
                          pd.get_dummies(titanic_data['embarked'], prefix="embark"),
                          pd.get_dummies(titanic_data['pclass'], prefix="class")], axis=1)

print(titanic_data.columns)  # 输出列名
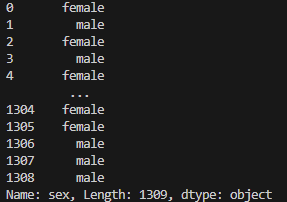
print(titanic_data['sex'])  # 输出sex列的值
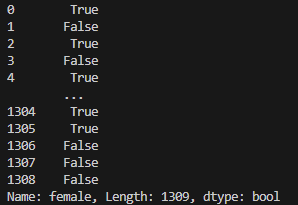
print(titanic_data['female'])  # 输出female列的值
titanic_data = pd.concat([titanic_data, pd.get_dummies(titanic_data['sex']), pd.get_dummies(titanic_data['embarked'], prefix="embark"), pd.get_dummies(titanic_data['pclass'], prefix="class")], axis=1)调用get_dummies()函数分别对sex,embarked,pclass列进行one-hot编码的转换,并将转换成one-hot编码后所生成的新列放到原有的数据后面。- get_dummies()函数会根据指定列中的离散值重新生成新的列,新列中的数据用0、1来表示是否具有该列的属性。
- 通过
print(titanic_data.columns) # 输出列名我们可以看出输出的列名要比上面的我们直接读取数据集后打印出的列名要多。
打印结果1如下:
- 在输出的结果中,female列之后都是one-hot转码后生成的新列,其中female为sex列中的离散值。我们可以看到
打印结果2如下:
- 与其对应的是我们打印结果3。
打印结果3如下:
- 从结果可以看出,在sex列中,值为female的行,在female列中值为1,这便是get_dummies() 函数作用的结果。
4. 对Nan值进行过滤填充
- 样本并不是每个属性都有数据的。
- 没有数据的部分在pandas库中会被解析为Nan值。
- 因为模型无法对无效值Nan进行处理,所以需要对Nan值进行过滤并填充。
- 在本例中,只对两个连续属性的数据列进行Nan值处理,即age和fare属性。
# 处理Nan值
titanic_data["age"]
titanic_data["age"].fillna(titanic_data["age"].mean())
titanic_data["fare"]
titanic_data["fare"].fillna(titanic_data["fare"].mean())  # 乘客票价
- 在上面的代码中,调用了fillna()函数对Nan值进行过滤,并用该数据列中的平均值进行填充。
5. 剔除无用的数据列
- 根据人们的经验,将与是否获救无关的部分数据剔除。
# 剔除无用的数据列
titanic_data = titanic_data.drop(['name', 'ticket', 'cabin', 'boat', 'body', 'home.dest', 'sex', 'embarked', 'pclass'], axis=1)
print(titanic_data.columns)
运行结果:
- 通过分析,乘客的名字,票号,船舱号等信息与其是否能够在灾难中生存下来的因素关系不大,故将这些信息删除。
- 同时,再将已经被one-hot转码的原属性列(如sex,embarked)删除。
- 通过运行上述代码后,我们得到了模型真正需要处理的数据列。
6. 分离样本和标签并制作成数据集
- 将survived列从数据列中单独提取出来作为标签。
- 将数据列中剩下的数据作为输入样本。
- 将样本和标签按照30%和70%比列分成测试数据集和训练数据集。
# 分离样本和标签
labels = titanic_data["survived"].to_numpy()

titanic_data = titanic_data.drop(['survived'], axis=1)
data = titanic_data.to_numpy()

# 样本的属性名称
feature_names = list(titanic_data.columns)

# 将样本分为训练和测试两部分
np.random.seed(10)  # 设置种子,保证每次运行所分的样本一致
train_indices = np.random.choice(len(labels), int(0.7*len(labels)), replace=False)
test_indices = list(set(range(len(labels))) - set(train_indices))
train_features = data[train_indices]
train_labels = labels[train_indices]
test_features = data[test_indices]
test_labels = labels[test_indices]
result1 = len(test_labels)
print(result1)
运行结果:
- 输出的结果393,表明测试数据共有393条。
7. 定义Mish激活函数与多层全连接网络
# 定义Mish激活函数
class Mish(nn.Module):
    def __init__(self):
        super().__init__()

    def forward(self, x):
        x = x * (torch.tanh(F.softplus(x)))
        return x

torch.manual_seed(0)  # 设置随机种子

class ThreelinearModel(nn.Module):
    def __init__(self):
        super().__init__()
        self.linear1 = nn.Linear(12, 12)
        self.mish1 = Mish()
        self.linear2 = nn.Linear(12, 8)
        self.mish2 = Mish()
        self.linear3 = nn.Linear(8, 2)
        self.softmax = nn.Softmax(dim=1)
        self.criterion = nn.CrossEntropyLoss()  # 定义交叉熵损失函数

    def forward(self, x): # 定义一个全连接网络
        lin1_out = self.linear1(x)
        out1 = self.mish1(lin1_out)
        out2 = self.mish2(self.linear2(out1))
        return self.softmax(self.linear3(out2))

    def getloss(self, x, y):  # 实现类的损失值计算接口
        y_pred = self.forward(x)
        loss = self.criterion(y_pred, y)  # 计算损失值的交叉熵
        return loss
- 我们手动设置随机种子,该代码会使每次运行的程序中的权重张量使用同样的初始值,保证每次的运行结果都一致。
8. 训练模型并输出结果
- code_02_moons_fun代码如下所示
import torch.nn as nn
import torch
import numpy as np
import matplotlib.pyplot as plt

# 继承nn.Module类,构建网络模型
class LogicNet(nn.Module):
    def __init__(self, inputdim, hiddendim, outputdim):  # 初始化网络结构
        super(LogicNet, self).__init__()
        self.Liner1 = nn.Linear(inputdim, hiddendim)  # 定义全连接层
        self.Liner2 = nn.Linear(hiddendim, outputdim) # 定义全连接层
        self.criterion = nn.CrossEntropyLoss()  # 定义交叉熵函数, 一定要加上括号,不可以直接写。

    def forward(self, x):  # 搭建用两个全连接层构建的网络模型
        x = self.Liner1(x)  # 将输入数据传入第1个全连接层
        x = torch.tanh(x)  # 对第一个连接层的结果进行非线性变换,使用激活函数tanh实现
        x = self.Liner2(x) # 将网络数据传入第2个链接层
        return x

    def predict(self, x):  # 实现LogicNet类的预测接口
        # 调用自身网络模型,并对结果进行softmax处理,分别得出预测数据属于每一类的概率
        pred = torch.softmax(self.forward(x), dim=1)
        return torch.argmax(pred, dim=1)  # 返回每组预测概率中最大值的索引

    def getloss(self, x, y):  # 实现LogicNet类的损失值接口
        y_pred = self.forward(x)
        loss = self.criterion(y_pred, y)  # 计算损失值的交叉熵
        return loss

def moving_average(a, w=10):  # 计算函数计算移动平均损失值
    if len(a) < w:
        return a [:]
    return [val if idx < w else sum(a[(idx-w):idx])/w for idx, val in enumerate(a)]

def plot_losses(losses):
    avgloss = moving_average(losses)  # 将获得损失值的移动平均值
    plt.figure(1)
    plt.subplot(211)
    plt.plot(range(len(avgloss)), avgloss, 'b--')
    plt.xlabel('step number')
    plt.ylabel('Training loss')
    plt.title('step number vs. Training loss')
    plt.show()

model = LogicNet(inputdim=2, hiddendim=3, outputdim=2)
def predict(x):  # 封装支持Numpy的预测接口
    x = torch.from_numpy(x).type(torch.FloatTensor)
    ans = model.predict(x)
    return ans.numpy()

def plot_decision_boundary(pred_func, X, Y):  # 在直角坐标系中可视化模型
    # 计算取值范围
    x_min, x_max = X[:, 0].min() - .5, X[:, 0].max() + .5
    y_min, y_max = X[:, 1].min() - .5, X[:, 1].max() + .5
    h = 0.01

    # 在坐标系中采用数据生成网格矩形,用于输入模型
    xx, yy = np.meshgrid(np.arange(x_min, x_max, h), np.arange(y_min, y_max, h))

    # 将数据输入并进行预测
    Z = pred_func(np.c_[xx.ravel(), yy.ravel()])
    Z = Z.reshape(xx.shape)

    # 将预测结果可视化
    plt.contourf(xx, yy, Z, cmap=plt.cm.Spectral)
    plt.title('Linear predict')
    arg = np.squeeze(np.argwhere(Y==0), axis=1)
    arg2 = np.squeeze(np.argwhere(Y==1), axis=1)
    plt.scatter(X[arg,0], X[arg, 1], s=100, c='b', marker='+')
    plt.scatter(X[arg2,0], X[arg2, 1], s=40, c='r', marker='o')
    plt.show()
- 完整代码如下所示
import numpy as np
import torch
import torch.nn as nn
import torch.nn.functional as F
import os
from scipy import stats
import pandas as pd

titanic_data = pd.read_csv("./titanic3.csv")
print(titanic_data.columns)

# 用哑变量将指定字段转成one-hot
titanic_data = pd.concat([titanic_data,
                          pd.get_dummies(titanic_data['sex']),
                          pd.get_dummies(titanic_data['embarked'], prefix="embark"),
                          pd.get_dummies(titanic_data['pclass'], prefix="class")], axis=1)

print(titanic_data.columns)  # 输出列名
print(titanic_data['sex'])  # 输出sex列的值
print(titanic_data['female'])  # 输出female列的值

# 处理Nan值
titanic_data["age"]
titanic_data["age"].fillna(titanic_data["age"].mean())
titanic_data["fare"]
titanic_data["fare"].fillna(titanic_data["fare"].mean())  # 乘客票价

# 剔除无用的数据列
titanic_data = titanic_data.drop(['name', 'ticket', 'cabin', 'boat', 'body', 'home.dest', 'sex', 'embarked', 'pclass'], axis=1)
print(titanic_data.columns)

# 分离样本和标签
labels = titanic_data["survived"].to_numpy()

titanic_data = titanic_data.drop(['survived'], axis=1)
data = titanic_data.to_numpy()

# 样本的属性名称
feature_names = list(titanic_data.columns)

# 将样本分为训练和测试两部分
np.random.seed(10)  # 设置种子,保证每次运行所分的样本一致
train_indices = np.random.choice(len(labels), int(0.7*len(labels)), replace=False)
test_indices = list(set(range(len(labels))) - set(train_indices))
train_features = data[train_indices]
train_labels = labels[train_indices]
test_features = data[test_indices]
test_labels = labels[test_indices]
len(test_labels)


# 定义Mish激活函数
class Mish(nn.Module):
    def __init__(self):
        super().__init__()

    def forward(self, x):
        x = x * (torch.tanh(F.softplus(x)))
        return x

torch.manual_seed(0)  # 设置随机种子

class ThreelinearModel(nn.Module):
    def __init__(self):
        super().__init__()
        self.linear1 = nn.Linear(12, 12)
        self.mish1 = Mish()
        self.linear2 = nn.Linear(12, 8)
        self.mish2 = Mish()
        self.linear3 = nn.Linear(8, 2)
        self.softmax = nn.Softmax(dim=1)
        self.criterion = nn.CrossEntropyLoss()  # 定义交叉熵损失函数

    def forward(self, x): # 定义一个全连接网络
        lin1_out = self.linear1(x)
        out1 = self.mish1(lin1_out)
        out2 = self.mish2(self.linear2(out1))
        return self.softmax(self.linear3(out2))

    def getloss(self, x, y):  # 实现类的损失值计算接口
        y_pred = self.forward(x)
        loss = self.criterion(y_pred, y)  # 计算损失值的交叉熵
        return loss

if __name__ == '__main__':
    net = ThreelinearModel()  # 实例化模型对象
    num_epochs = 200  # 设置训练次数
    optimizer = torch.optim.Adam(net.parameters(), lr=0.04)  # 定义优化器

    # 将输入的样本标签转为张量
    # input_tensor = torch.from_numpy(train_features).type(torch.FloatTensor)
    train_features = train_features.astype(np.float32)
    input_tensor = torch.from_numpy(train_features)

    label_tensor = torch.from_numpy(train_labels)
    losses = []  # 定义列表,用于接收每一步的损失值

    for epoch in range(num_epochs):
        loss = net.getloss(input_tensor, label_tensor)
        losses.append(loss.item())
        optimizer.zero_grad()  # 清空之前的梯度
        loss.backward()  # 反向传播损失值
        optimizer.step()  # 更新参数
        if epoch % 20 == 0:
            print('Epoch {}/{} => loss: {: .2f}'.format(epoch+1, num_epochs, loss.item()))


    os.makedirs('models', exist_ok=True)  # 创建文件夹
    torch.save(net.state_dict(), 'models/titanic_model.pt')  # 保存模型

    from code_02_moons_fun import plot_losses
    plot_losses(losses)  # 显示可视化结果

    # 输出训练结果
    out_probs = net(input_tensor).detach().numpy()
    out_classes = np.argmax(out_probs, axis=1)
    print("Train Accuracy:", sum(out_classes == train_labels) / len(train_labels))

    # 测试模型
    # test_input_tensor = torch.from_numpy(test_features).type(torch.FloatTensor)

    test_input_tensor = torch.from_numpy(test_features)
    out_probs = net(test_input_tensor).detach().numpy()
    out_classes = np.argmax(out_probs, axis=1)
    print("Test Accuracy:", sum(out_classes == test_labels) / len(test_labels))
运行的结果:

我们可以看到训练的准确率和测试的准确率,但是我们的图像不显示,我也不知道原因,有大神看到的话可以指导一二。


 随时随地看视频


